

Article
PapEye Dirt Count in tissue and paper mills: scanned samples instead of manual dirt counting
The first PapEye Dirt Count applications have been delivered to tissue and paper producers. In these laboratories the software has taken over a task that was done by eye: counting and sizing the dirt specks in pulp, paper and board samples over a light table or with a magnifier and a reference chart.
Manual dirt counting is slow, and its result depends on the inspector. Two people count the same sheet differently, and the same person counts differently at the end of a shift. With PapEye Dirt Count the samples are scanned on an ordinary flatbed scanner, the software finds and measures every speck, and the inspector reviews a list of close-ups instead of searching the sheet. The count, the area of each speck and its visual impact are recorded, and the same sheets can be re-analyzed later with the same settings.
What sizes of dirt it detects
Dirt Count reports every speck between a lower and an upper area limit. By default the limits are 0.02 mm² and 3 mm², which is a speck of roughly 0.16 mm to 2 mm in diameter if it were round. The lower limit can be set down to 0.002 mm², about 0.05 mm in diameter; specks above the upper limit are not reported.
The scan resolution decides how small a speck can be measured. At 600 DPI one pixel is about 0.042 mm wide, so the default lower limit of 0.02 mm² corresponds to roughly 11 pixels; at 1200 DPI one pixel is about 0.021 mm, and the same speck covers about 45 pixels. For the default limits, 600 DPI is enough. To count specks below the default limit, scan at 1200 DPI, because a speck only a few pixels across cannot be outlined reliably and small specks are undercounted.
Three more settings decide what is accepted as dirt:
- Contrast. An optional minimum contrast against the background, so that faint shade variation in the sheet is not counted.
- Shape. An option to accept only compact, speck-like shapes, which rejects most fibers and streaks.
- Edge level. Where the outline of a speck is drawn, which sets the measured area consistently from sample to sample.
For each accepted speck, Dirt Count records the area in mm² and the equivalent black area (EBA), which combines the area with the darkness of the speck. A pale speck has a smaller EBA than a black speck of the same size, so two samples with the same count can still be told apart by how visible their dirt is. The EBA follows the visual-impact idea of TAPPI T 563 and ISO 5350-4, but the software does not implement a TAPPI or ISO dirt count standard; it is Tapio's own method for quality control, trend monitoring and comparisons made with the same sampling and scanning routine.
Regular flatbed scanners as the measurement instrument
Dirt Count works on images from a standard tabletop flatbed scanner. There is no camera rig, no light table and no other Tapio hardware, and the samples need no printing, staining or other preparation: the specks are measured against the background of the material itself. The samples are scanned at 600 to 1200 DPI into a folder, and that folder is what the software analyzes. Scanners with an automatic document feeder make batches of sheets quick to scan, and the images can be PNG, JPEG, BMP, GIF or PDF files.
The scanner does affect the result: its resolution, sharpness, tonal response and settings decide which specks stand out from the background. For results that you want to compare over time, keep the scanner, the resolution and the scanner settings fixed. Dirt Count has the same scanner calibration features as the other PapEye applications, and calibration can be done as required. Tapio keeps a list of recommended scanner models that have worked well for dirt counting; ask us for it before buying a scanner for this purpose.
Results and statistics from a folder of sample images
When multiple sample images are scanned into a folder, the software can analyze the same sample areas in the entire folder at once. The image list on the left of the window shows every scan in the folder, and the software analyzes them all with the same settings and the same measurement area. Overlapping regions are counted only once.
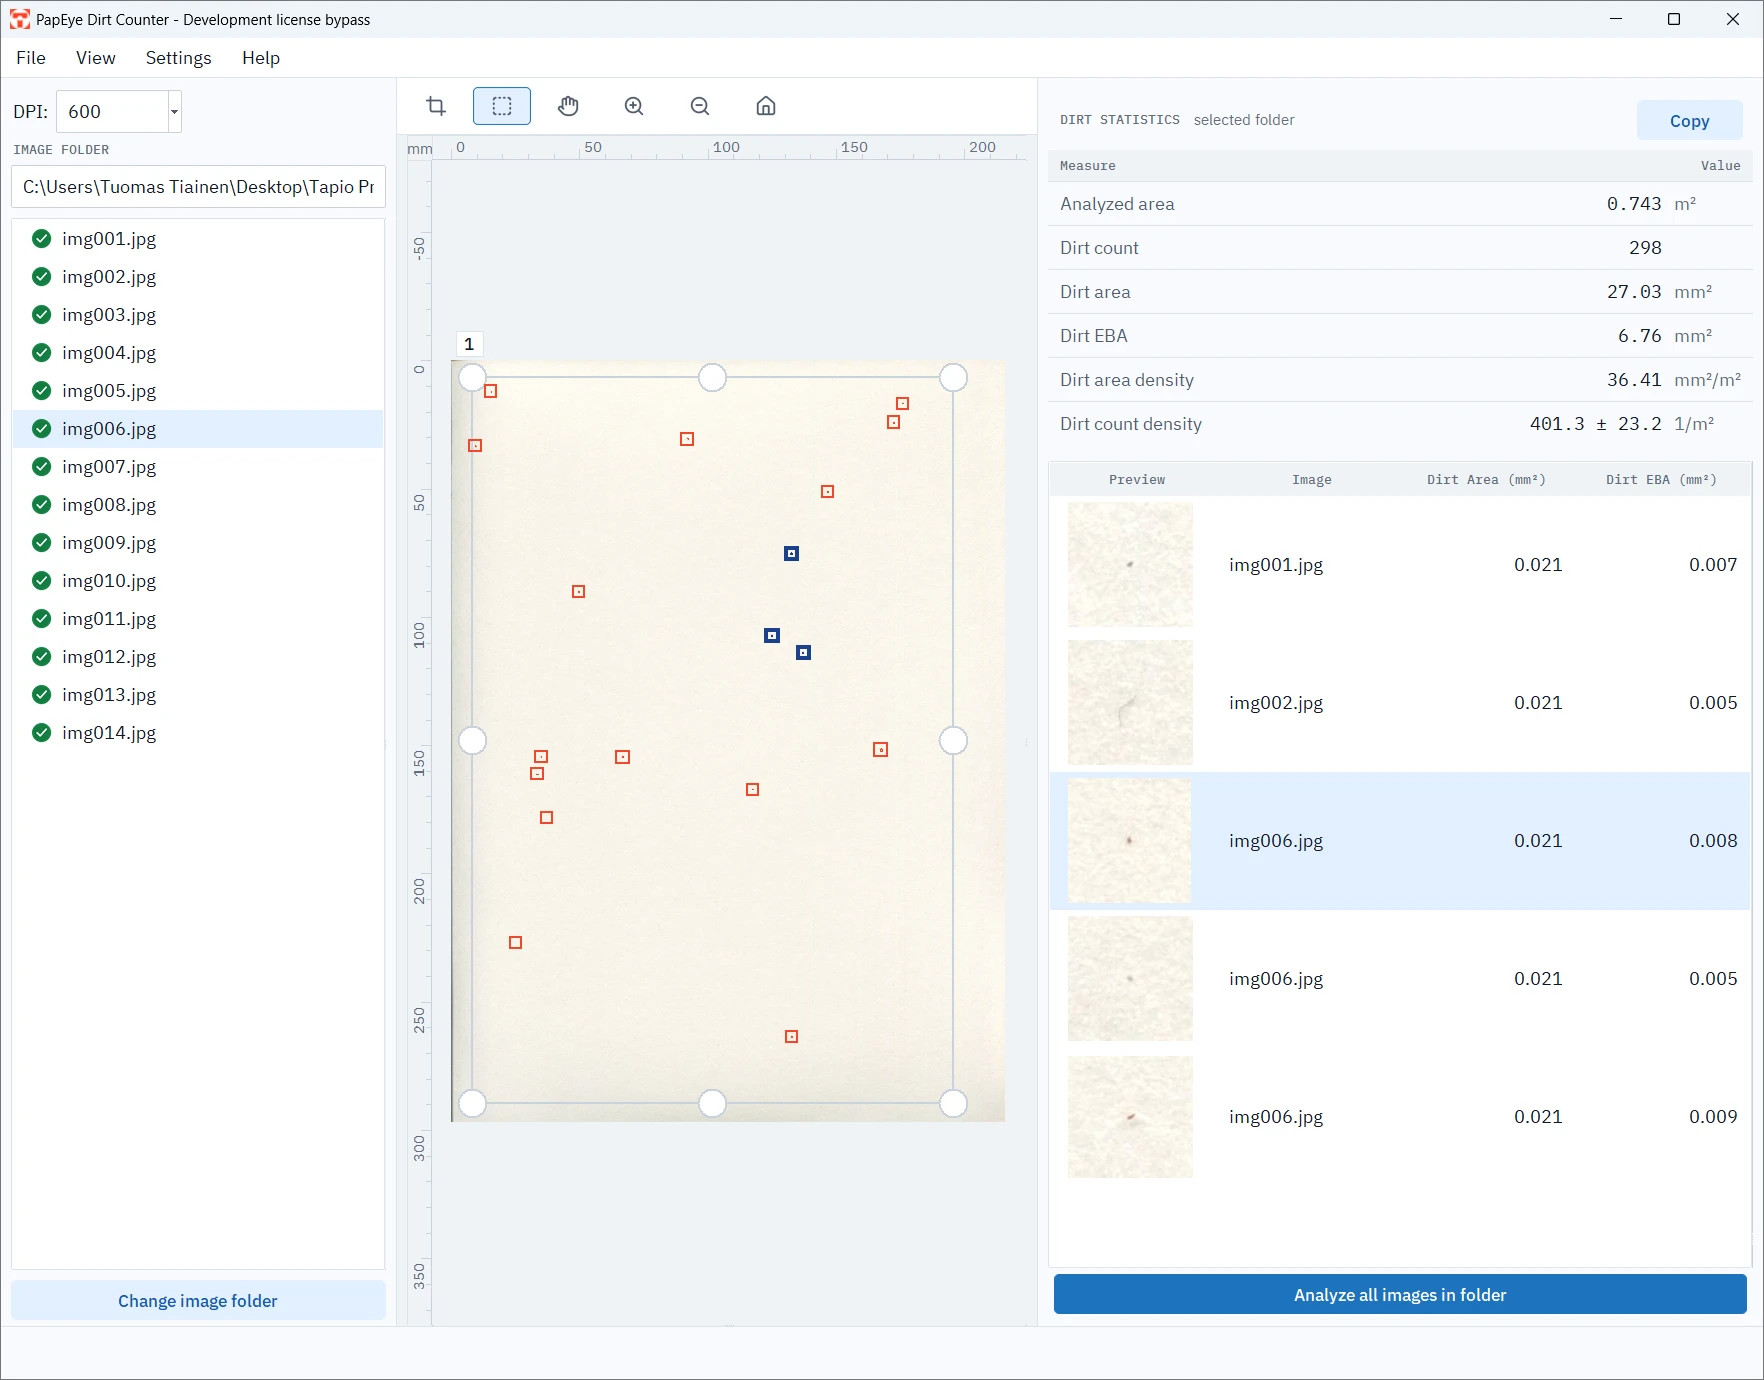
The statistics can be viewed for one image or for the whole folder. For the folder, Dirt Count reports the analyzed area in m², the dirt count, the total dirt area and EBA in mm², the dirt area density in mm²/m² and the dirt count density per m². The count density is shown with its counting uncertainty.
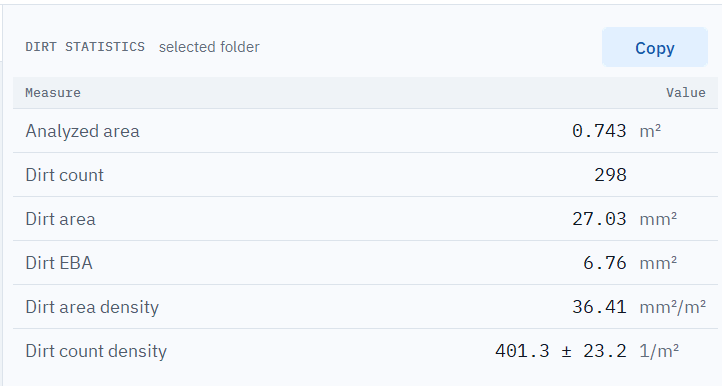
The calculated uncertainty is based on assuming a Poisson distribution, where counting N specks gives a standard deviation of about √N. This means measuring about a hundred specks corresponds to 10 % relative counting standard deviation.
This is why it is important to have a large enough counting area and to use the folder mode of PapEye Dirt Count if necessary. A clean paper grade may have only a few specks per sheet, and ten sheets scanned into the same folder can give a result with a sensible counting uncertainty. The total uncertainty of a result can also depend on how the samples were taken, so the sampling and scanning routine should stay the same from one analysis to the next.
Below the statistics, every detected speck is listed with a close-up, its area and its EBA. The inspector goes through the list and excludes anything that is not dirt, such as a fiber, a crease or dust on the scanner glass. The totals update as detections are excluded. The statistics and the full list of specks are exported to CSV, which opens in Excel, or copied to the clipboard for a report.
Where it fits
PapEye Dirt Count is one of three PapEye applications for scanned samples, and the one that is not about print. PapEye Print Uniformity measures mottling, graininess and banding of printed areas, and PapEye Line Quality measures the width and sharpness of printed lines. Each application runs on Windows or Linux, needs no installation and is sold as a permanent license for one PC.
If your laboratory still counts dirt by eye, ask us for a demonstration on your own samples. Tell us which grades you inspect and how you sample them today, and we can suggest a scanner and a scanning routine to go with the software.
See PapEye on your own samples
Tell us what you scan and with which scanner, and we arrange a demonstration or a quote for the PapEye application you need.