

Laboratory analyzers
Tapio Analyzers pinpoint the source of variation
A troubleshooting and development system for paper, board, tissue and nonwoven grades. Several calibrated sensors measure the same point in the sample at a 1 mm sampling step, under controlled laboratory conditions.
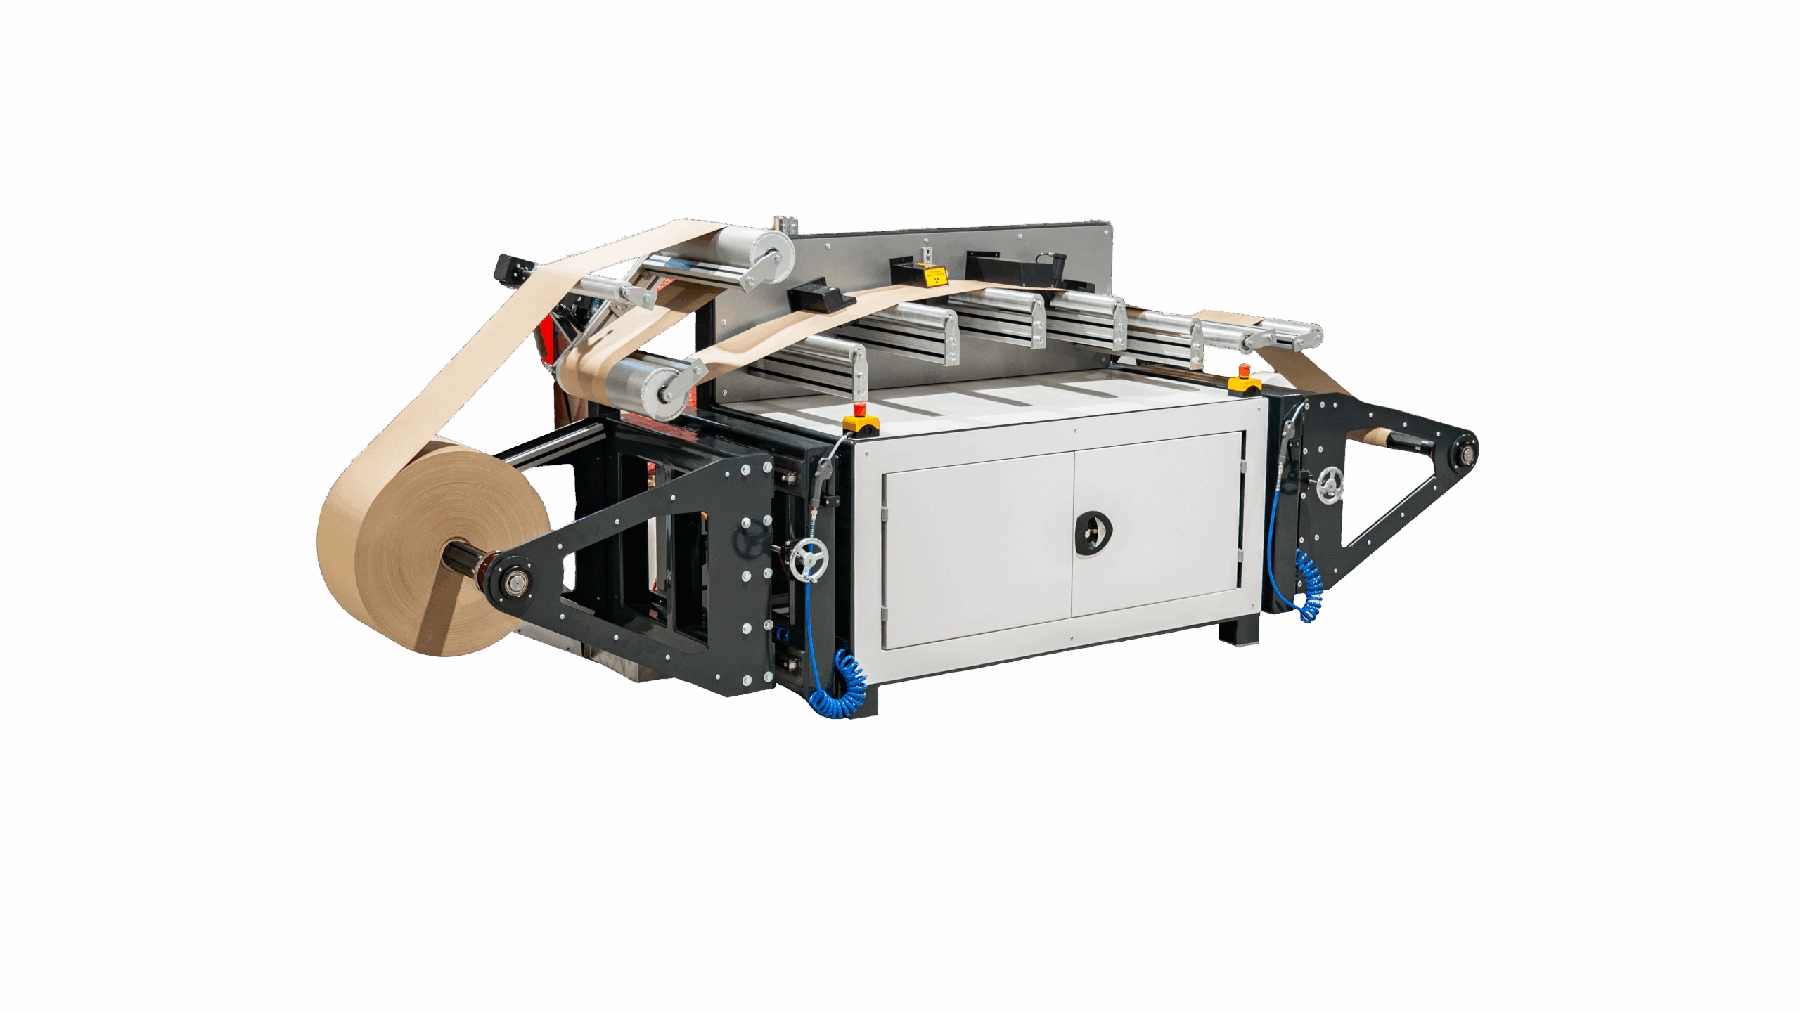
Quality variation is hard to fix when you cannot see where it comes from. Online scanners average and filter; standard laboratory tests give single values. A Tapio Analyzer moves the web at a controlled speed and records millimetre-resolution data from several sensors at exactly the same point, so you can correlate the channels and trace the variation to its source. The system supports both quality control and process development.
What you can do with an analyzer
- Troubleshoot the root causes of quality variation
- Test profiles, including the profile edges
- Test formation
- Detect quality problems
- Verify and calibrate online measurements
- Reduce unnecessary over-quality and material waste
- Maintain customer satisfaction and improve profitability
The analysis tools cover spectral analysis, CD profiles, band-pass filters, statistics, formation analysis, correlation studies and QCS comparison.
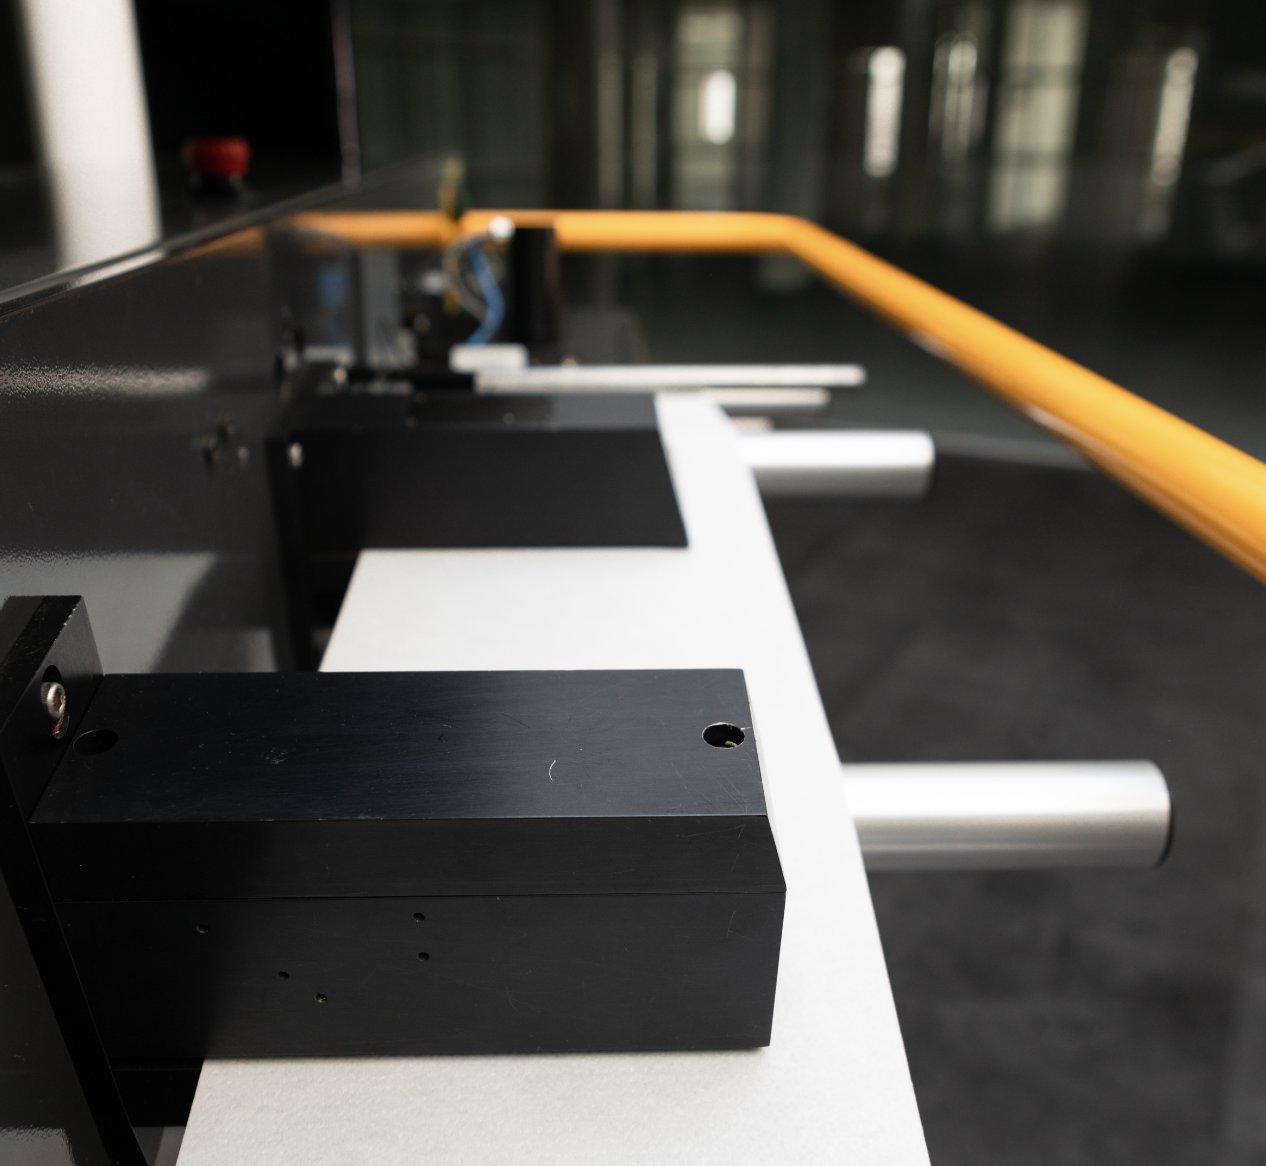
MD rolls or CD strips
The analyzer measures almost all paper and board grades, as well as tissues, nonwovens and other suitable rolled products, in two sample formats.
| MD roll | CD strips | |
|---|---|---|
| Sample | An MD roll up to 1 m in diameter | 20 full-width CD strips cut from a parent reel, taped together into a sample roll |
| What it covers | Variation along the machine direction, over many kilometres of production | A true CD profile across the full width, including the edges, without MD distortion |
| Typical questions | Which roll, felt, wire or pump causes a periodic variation? Is barring or winder vibration linked to the product? | Is the variation linked to actuator spacing? How do the edges behave? Does the QCS profile match? |
| Main analysis tools | MD profile, MD spectrum and spectrogram, formation, machine-element matching | CD profile, CD spectrum, CD formation, variance component analysis, QCS comparison |
Choose your sensors
Basis weight, caliper, gloss, ash, transmission, remission and porosity sensors are available, and the analyzer can be supplemented with custom sensors. A typical setup has sensors for basis weight, caliper, dual-sided gloss, ash and transmission.
Basis weight
Beta radiation (Kr-85), 5 mm aperture, all grades up to 1000 g/m².
Caliper
Contacting caliper, 0.3 mm contact area, range up to 800 μm.
Gloss
Dual-sided, standard 75° angle, 1 × 1.2 mm aperture.
Ash
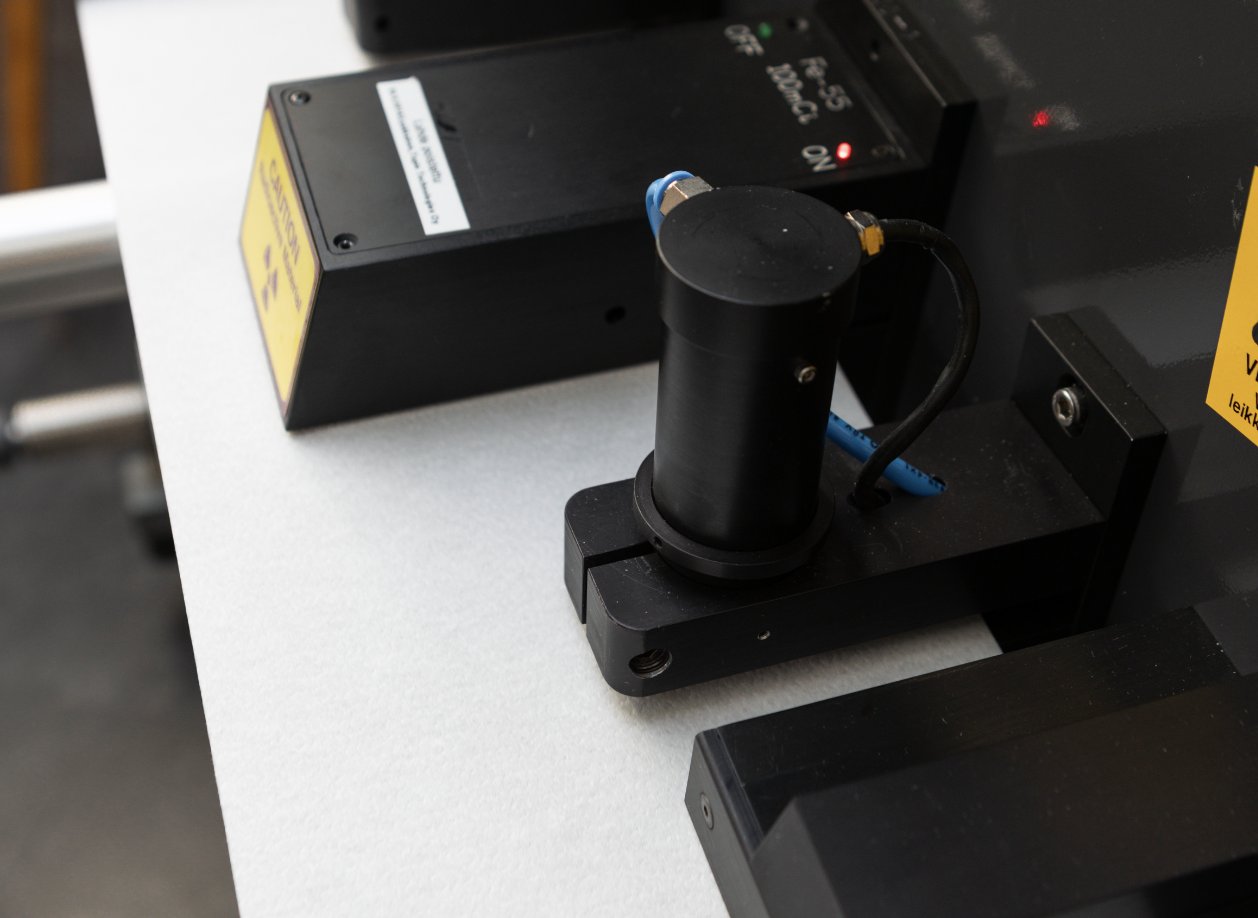
Low-energy x-rays (Fe-55), 5 mm aperture, for coated and filled grades.
Transmission
Red or IR light, 1 mm aperture; optical formation and flock size.
Remission
Brightness variation with a 0.3 mm aperture.
Porosity
Air permeability under constant pressure, according to laboratory standards.
Calculated channels
Density, bulk, relative ash and optical formation, calculated from the same points.
Compare all sensors and their applications
Sample output
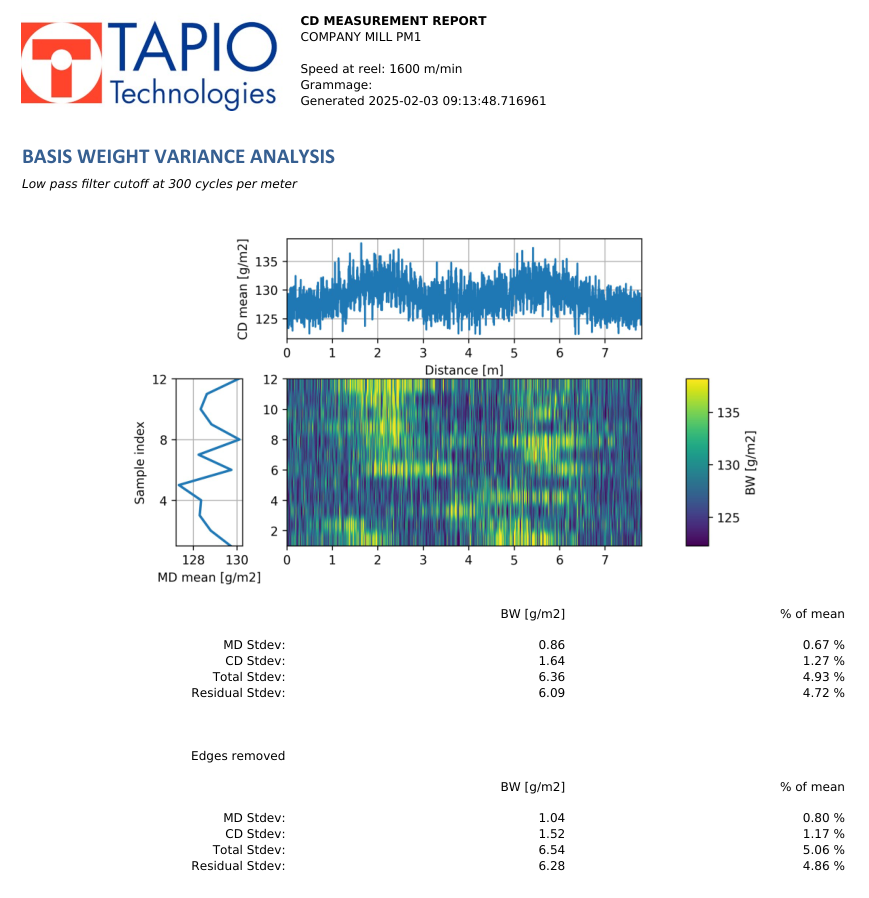
A CD measurement report
This report page shows a basis weight variance analysis of a CD sample set. The colour map shows every CD strip, the plots show the mean CD and MD profiles, and the table splits the variation into MD, CD and residual components, with and without the edges.
Reports like this are generated automatically from the measured data with the Tapio Analysis software and can be edited.
Tapio Analysis software
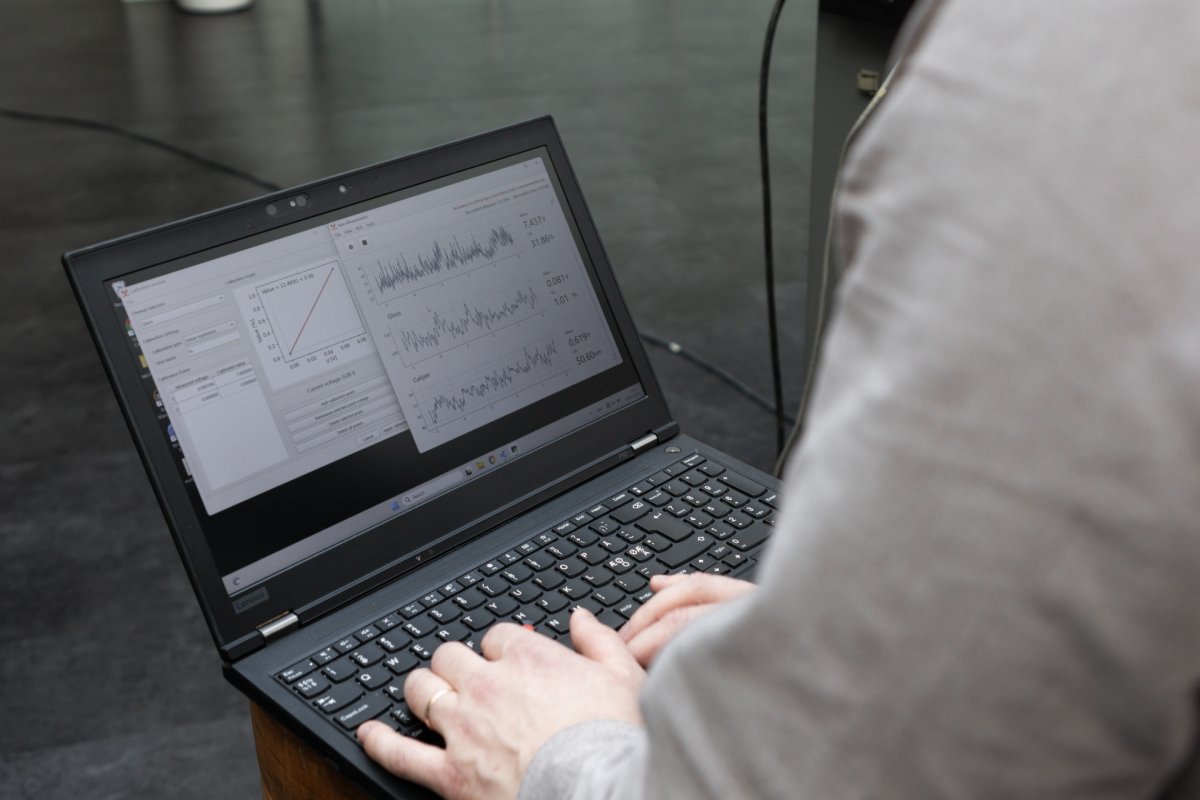
Tapio Analysis is free, open-source software for analysing all Tapio measurement data, built to help paper and board mills improve quality and solve production problems. The software is approved by all major papermakers and paper machine builders.
CD and MD analysis
True CD profiles, MD profiles, filtering, statistics, formation analysis and variance component analysis.
Spectral analysis
Find the source of periodic variation, for example roll or pump rotating frequencies.
Correlation tools
Every sensor measures the same spot, so channels can be correlated with each other.
Benchmarking
Benchmarking, guarantee assessment and before/after rebuild verification.
Any sensor data
Online sensor data and other external data can be analysed with a custom loader.
In use
Roll geometry research at Aalto University
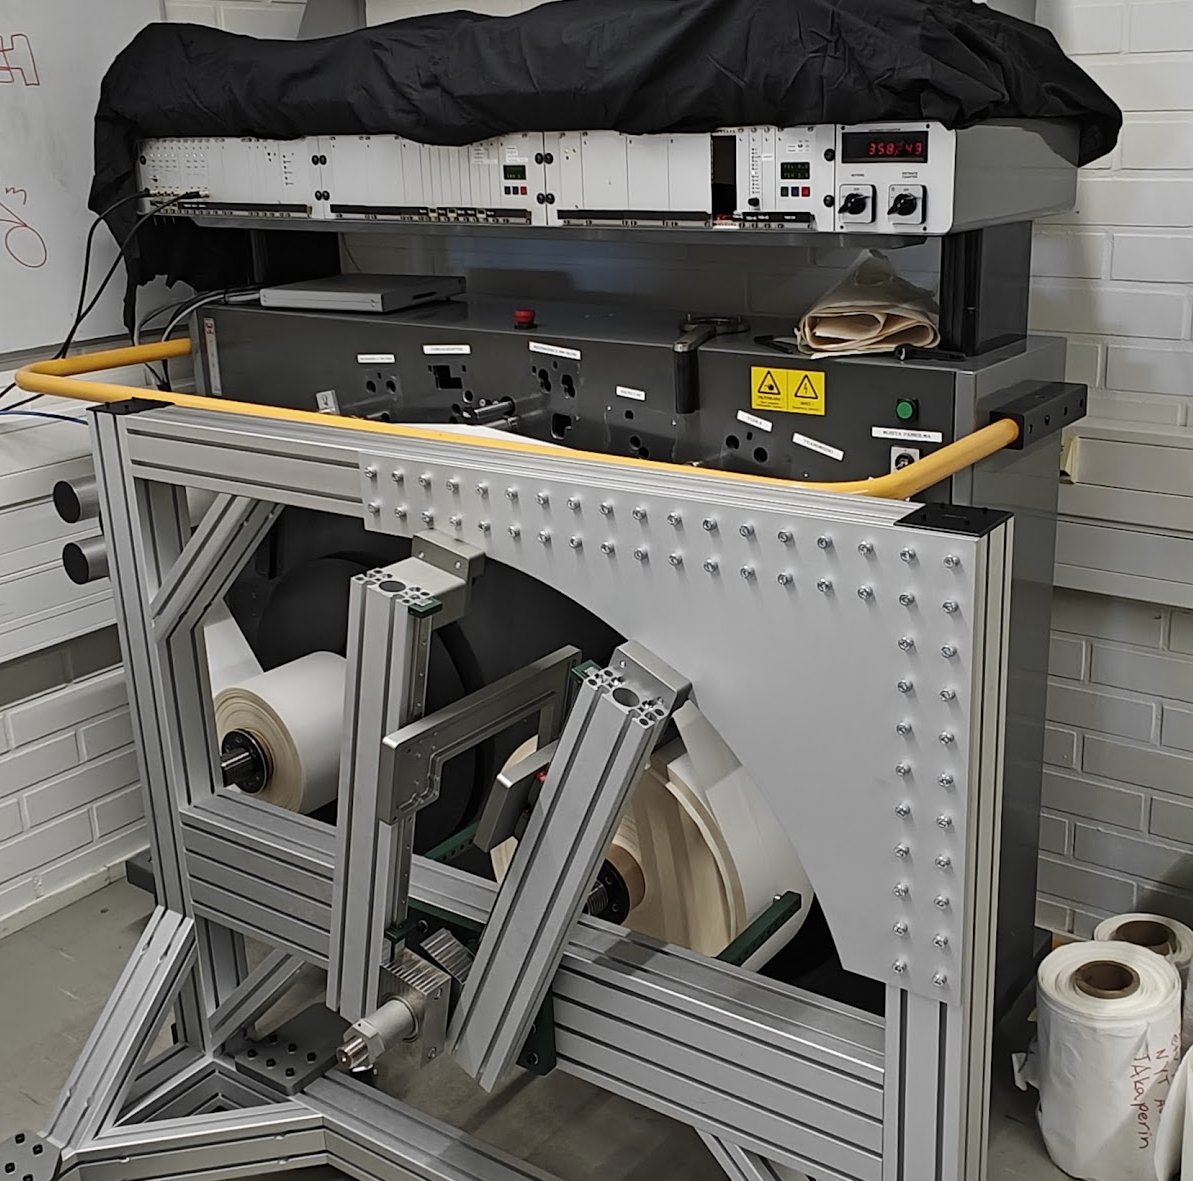
Tapio has provided Aalto University researchers with a Tapio Analyzer for roll geometry studies. The setup combines high-resolution caliper measurement with a multi-probe roundness measurement, to study how paper thickness variation affects roll roundness, one of the mechanisms behind winder vibration.
Tapio Analysis laboratory measurements reveal real MD and CD variation that online scanners cannot always detect. They are an excellent tool for troubleshooting paper machine quality problems.
— Pekka Komulainen, Independent Consultant, Pele Oy
Not ready to invest? Start with the service
You may not be ready to invest in your own analyzer. Our Tapio Analysis service measures your MD rolls or CD strips in our laboratory and delivers a detailed report and a review meeting with our specialists.
It is often the fastest way to understand a recurring variation or verify a suspected root cause, and a practical way to see what the system reveals about your paper before deciding on your own instrument, without upfront investment.
Related articles
Discuss an analyzer configuration
Tell us about your grades and the variation you are chasing, and we will suggest a sensor configuration. Or start with the Tapio Analysis service in our laboratory.