

Tapio Analysis service
Find the root cause of MD and CD variation
Independent high-resolution diagnostics for paper, board and nonwoven producers. Send us an MD roll or a set of CD strips, and we identify the likely sources of profile variation and instability. Measurement results typically within two working days of receiving your samples.
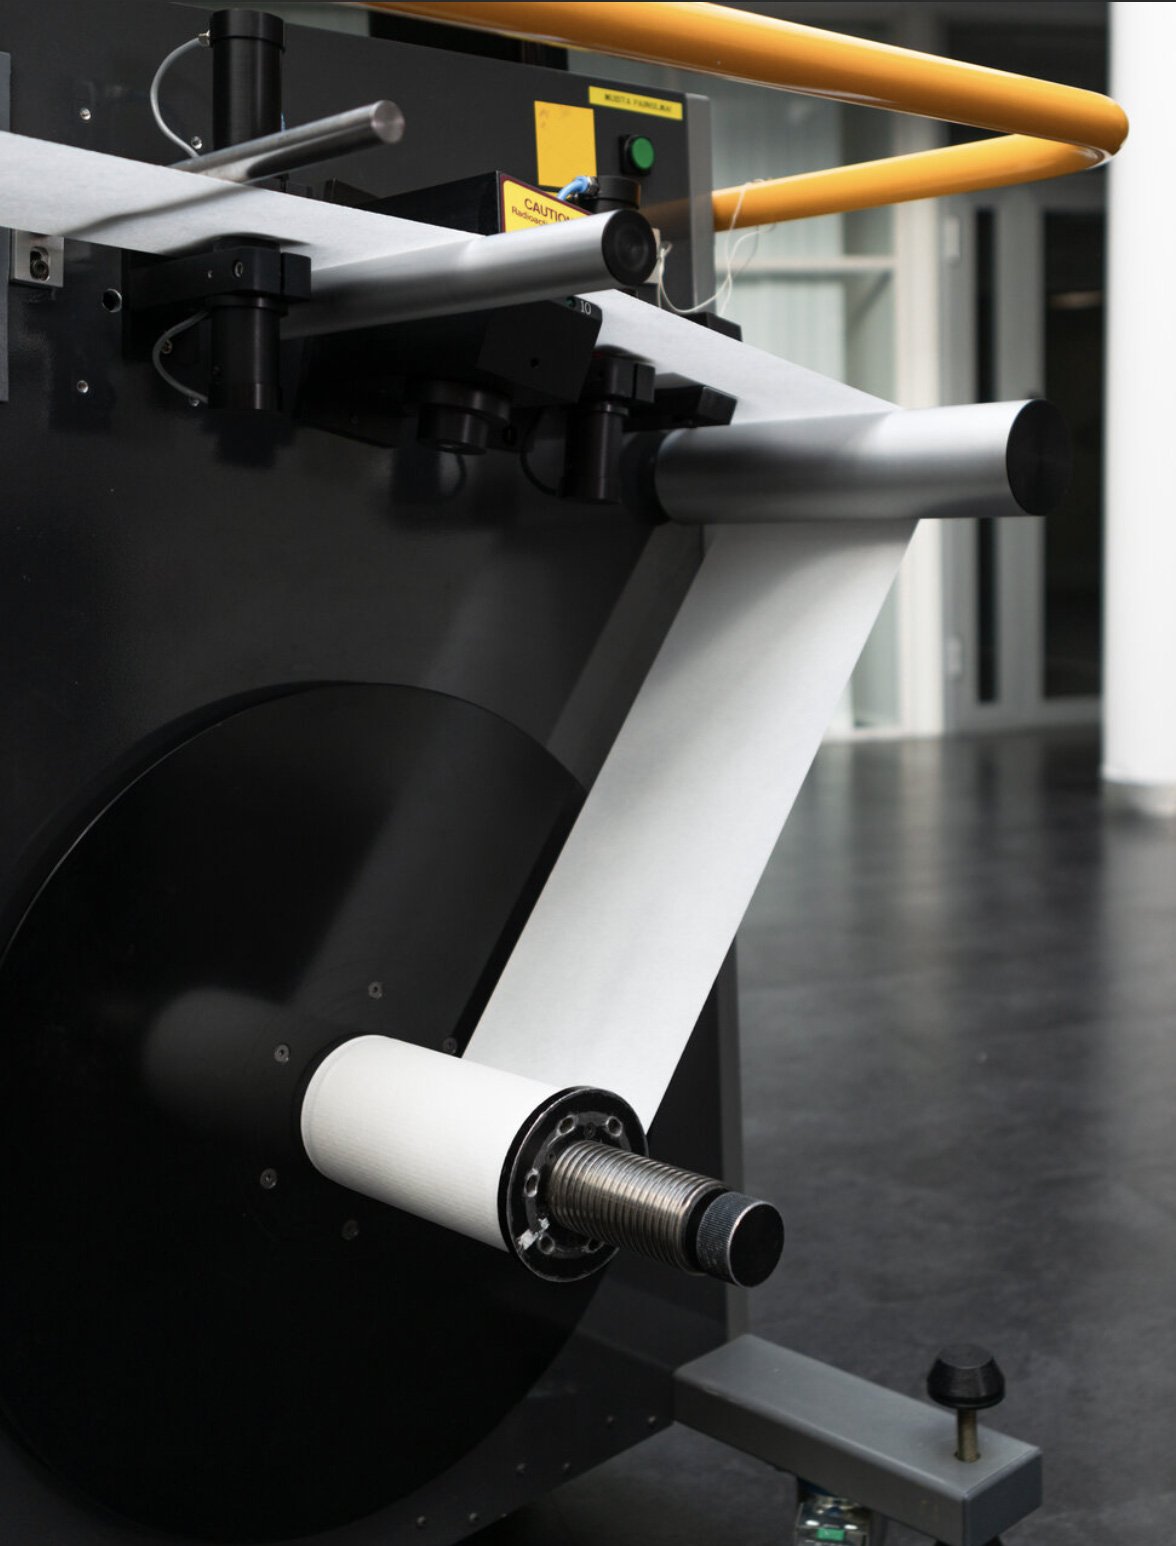
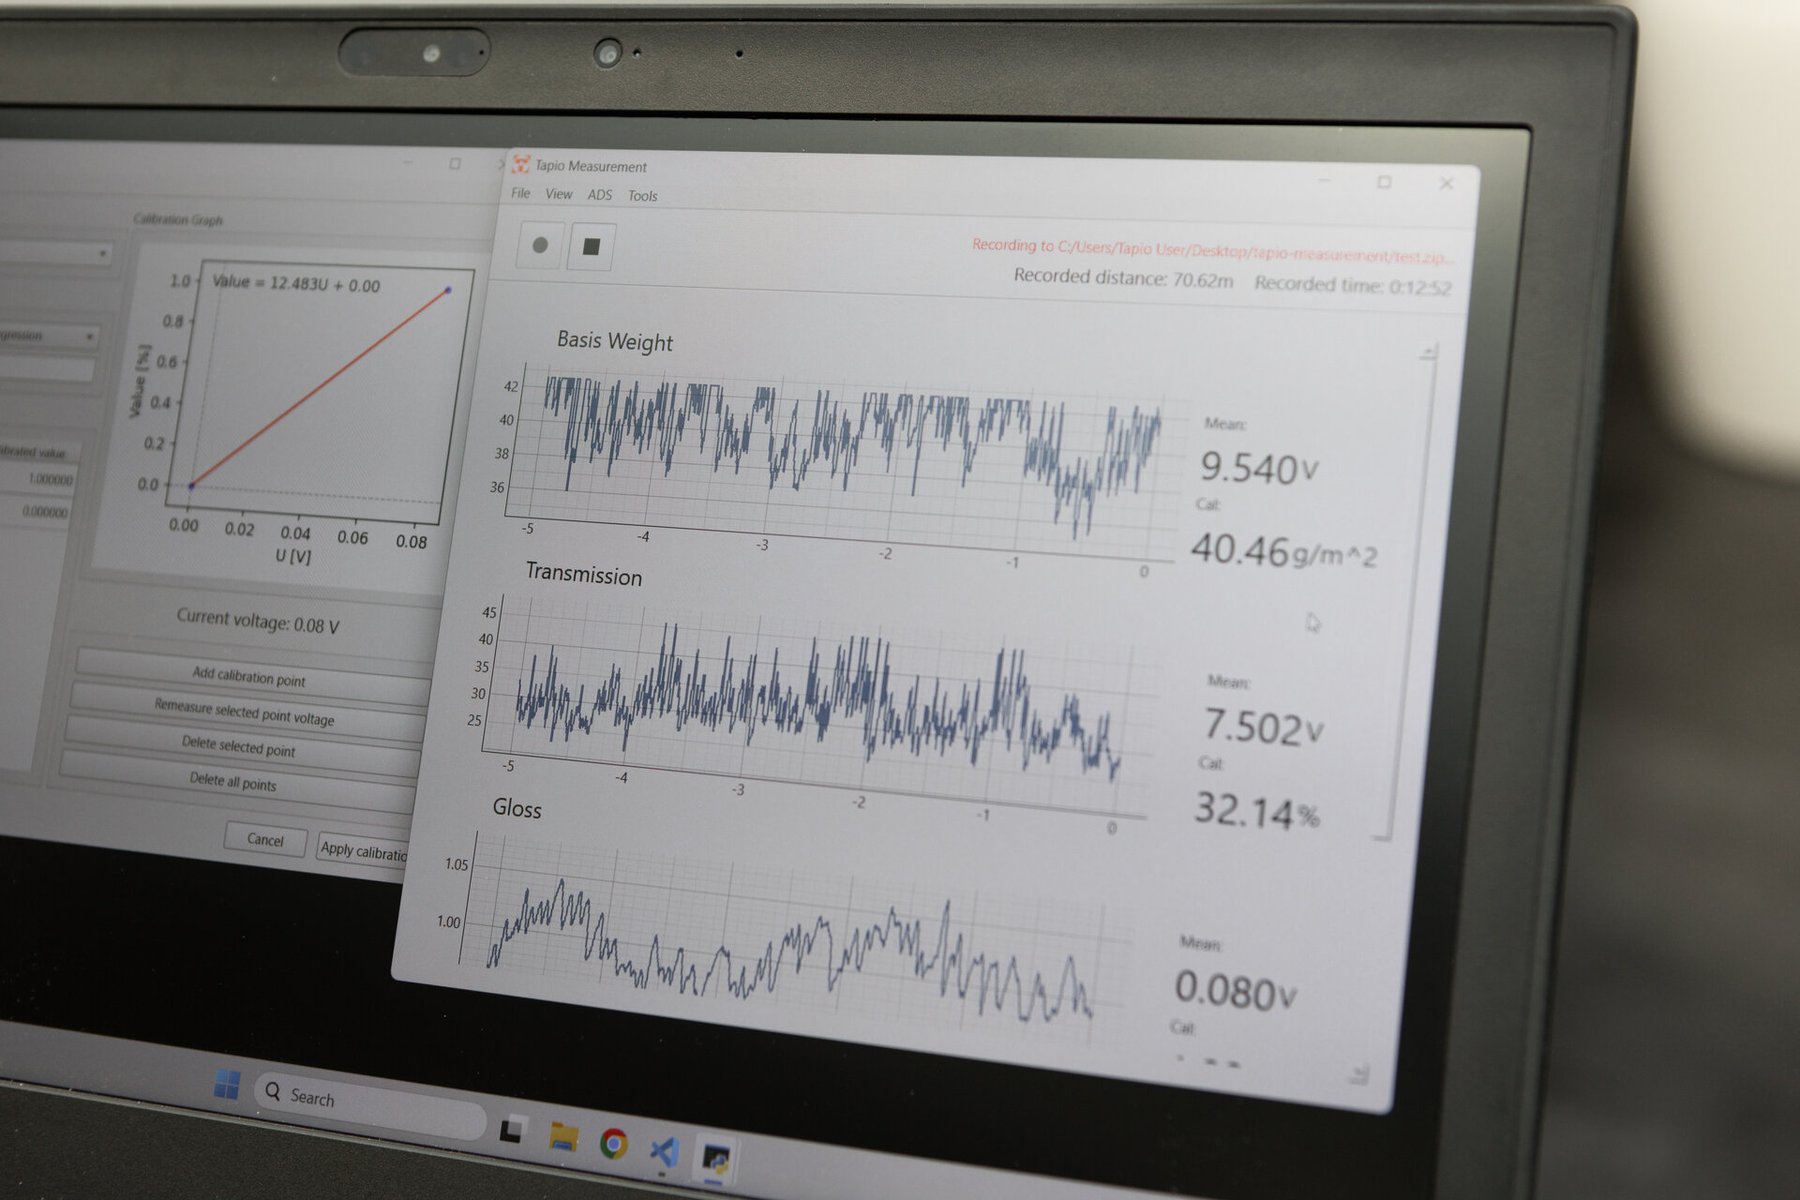
Online scanners and standard laboratory tests tell you that something varies. Tapio Analysis shows where it comes from. We measure continuous MD and CD profiles at high resolution, non-destructively, with every sensor measuring the same point in the paper. You see how basis weight, caliper, formation, ash, gloss and other properties vary, at which wavelengths, and how they are related, and we connect the variation to machine elements, actuators or process conditions.
Every project includes a written expert report and an online review of the findings with our specialists. The service suits all paper, board and nonwoven grades.
Problems we solve
Use Tapio Analysis when standard measurements have not solved a problem, or when several root causes are possible.
Unexplained CD or MD variation
You see variation but don't know where it comes from, or QCS data does not match what you see in production. We locate the machine components behind caliper, basis weight or gloss variation.
Barring and calendering problems
Pinpoint the barring frequency, find faulty calender rolls and determine whether barring originates from the wet end or the coating stations.
Vibration and winder problems
You suspect vibration but cannot link it to a component. We check whether winder vibration aligns with periodic MD variation from specific rolls, using spectra against known roll diameters and speeds.
CD profile and actuator effects
Get a high-resolution, full-width CD profile, including the very ends. Connect CD variation to actuator spacing, or investigate instability after control or setting changes.
Before and after a rebuild or trial
Quantify how quality properties changed after a rebuild, trial or adjustment. Also for guarantee validation and benchmarking.
Comparing papers, suppliers or trials
Show whether nominally similar papers or boards differ in the magnitude and structure of their variation, not only in their averages.
Drying and dimensional stability
Drying shrinkage causing MD or CD variation, and curl, strain or instability related to the drying section.
Printability and surface quality
Print mottle, gloss variation across the sheet, formation problems affecting print quality, and customer complaints about print appearance.
QCS accuracy verification
Compare Tapio laboratory measurements with your online QCS data using the built-in comparison tools.
How Tapio Analysis finds the source
We combine high-resolution laboratory measurement with spectral, time-domain and correlation analysis:
- Matching MD wavelengths to roll diameters and other rotating components
- Linking CD variation to actuator spacing
- Identifying vibration sources, including the winder and dryer sections
- Analysing formation, gloss and print-related variation at high resolution
- Comparing channels: because every sensor measures the same point, the property in which a variation appears points to where it is generated, for example forming, pressing or coating
When roll diameters, rotation speeds or CD actuator spacings are available, the software connects periodic variation to these machine elements automatically.
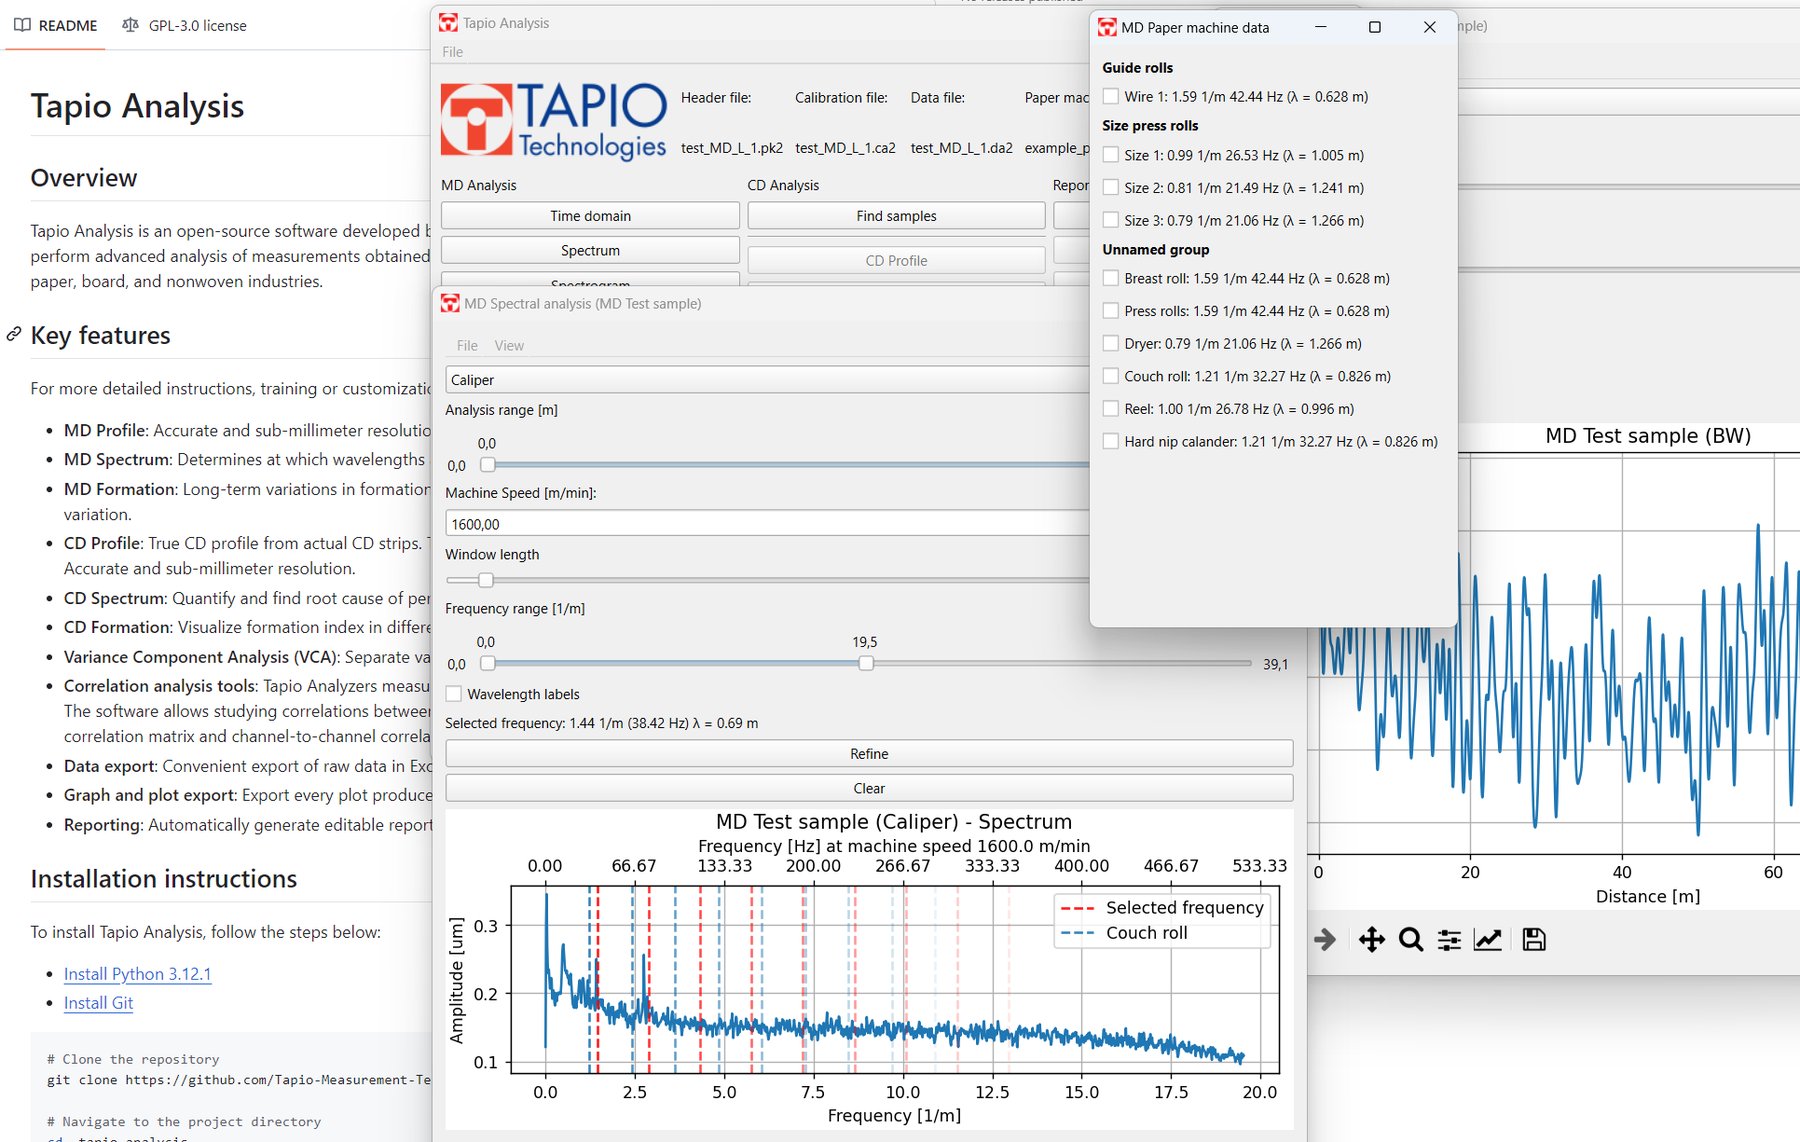
Caliper spectrum · matching a peak to a machine element
Millimetre-level resolution
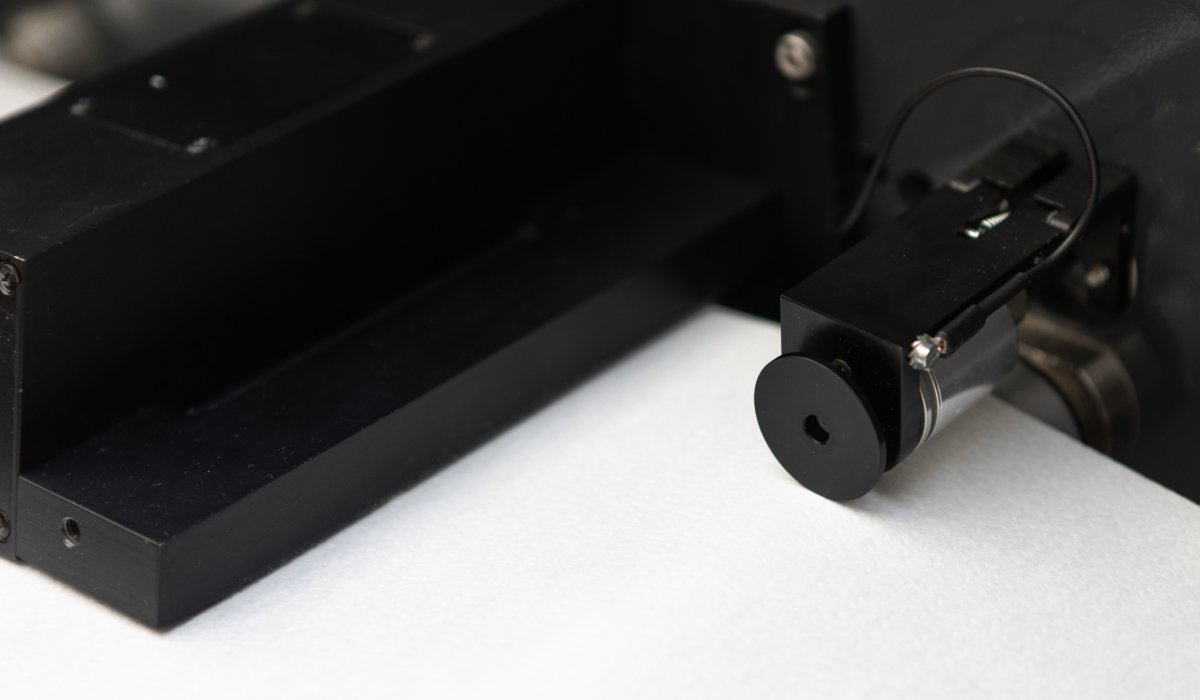
A 1 mm sampling step and small measurement spots reveal fine-scale and periodic variation that averaging and high-speed scanning hide.
True CD profiles across the full width
Measured from real CD strips across the whole web, with no heavy filtering and no compromise in data quality.
Same point, every sensor
All sensors measure the same physical point in the paper, which makes multi-parameter correlation analysis possible.
Controlled laboratory conditions
Slow-speed measurement gives an accuracy that is not possible at production speed.
Independent assessment
Tapio is not connected to machine suppliers or QCS vendors, so the analysis is unbiased.
Open-source software
The Tapio Analysis software used for the data processing is open source and free to all customers, so you can explore the data alongside our report.
What you send and what you get back
What you send
- For MD analysis: a small MD sample roll, for example 70 cm in diameter and 20 cm wide on a standard 3″ core. If you cannot cut it to size, send a roll of any size and we handle the cutting.
- For CD analysis: a set of 20 full-width CD strips cut from the parent reel. Hand-cut strips are fine.
- Your case: grade, nominal basis weight and a short description of the problem.
- Machine data, if available: machine speed, roll diameters and rotating speeds for MD analysis, CD actuator spacings for CD analysis, and earlier QCS or measurement data for comparison.
What you get back
- High-resolution MD and/or CD profiles of the standard parameters
- Statistics, spectra and correlations between properties
- Matching to machine elements where machine data is available
- A detailed written report with expert observations and conclusions; measured findings are kept separate from their interpretation, with further checks recommended where needed
- An online review meeting with Tapio specialists
- Additional comparison plots when needed
- Raw measurement data on request, for your own follow-up studies
What we measure
The standard high-resolution dataset, measured with a Tapio Analyzer:
- Basis weight
- Caliper
- Transmission / optical density (optical formation)
- Density and bulk
- Ash variation and relative ash profile
- Dual-sided gloss
Porosity is available on request for suitable grades, and any of the Tapio sensors can be used. Properties such as tensile strength or elongation can be measured as profiles through our partner network, by cutting the samples for destructive testing after the Tapio measurement.
Standard sample spacing is 1 mm in CD measurements and 10 mm in MD measurements.
Comparing machines, grades and trials
The same analysis puts several measurements side by side on identical terms: every record cut to the same length and every spectrum computed with the same settings, so a difference between two curves is a difference in the paper, not in the processing. That is how we compare machines, competing grades, or the same machine before and after a rebuild or a trial.
Caliper spectrum comparison · four machines
Caliper variation by wavelength band
How the service works
- 01
Describe your case
Tell us about your machine, grade and problem in the request form. Not sure which samples you need? Describe the situation and we will help you scope the analysis.
- 02
Get a confirmed scope and quotation
We confirm the scope and quotation and send shipping instructions before you send any samples. We typically respond within one working day.
- 03
Send your samples
Prepare an MD roll, CD strips or both, following the sample preparation instructions, and ship them to our laboratory in Espoo by courier.
- 04
Measurement, report and review
We measure the samples within two working days of receiving them, analyse the data and send you the report. Then we go through the findings together in an online meeting.
Application example: tracing a barring frequency
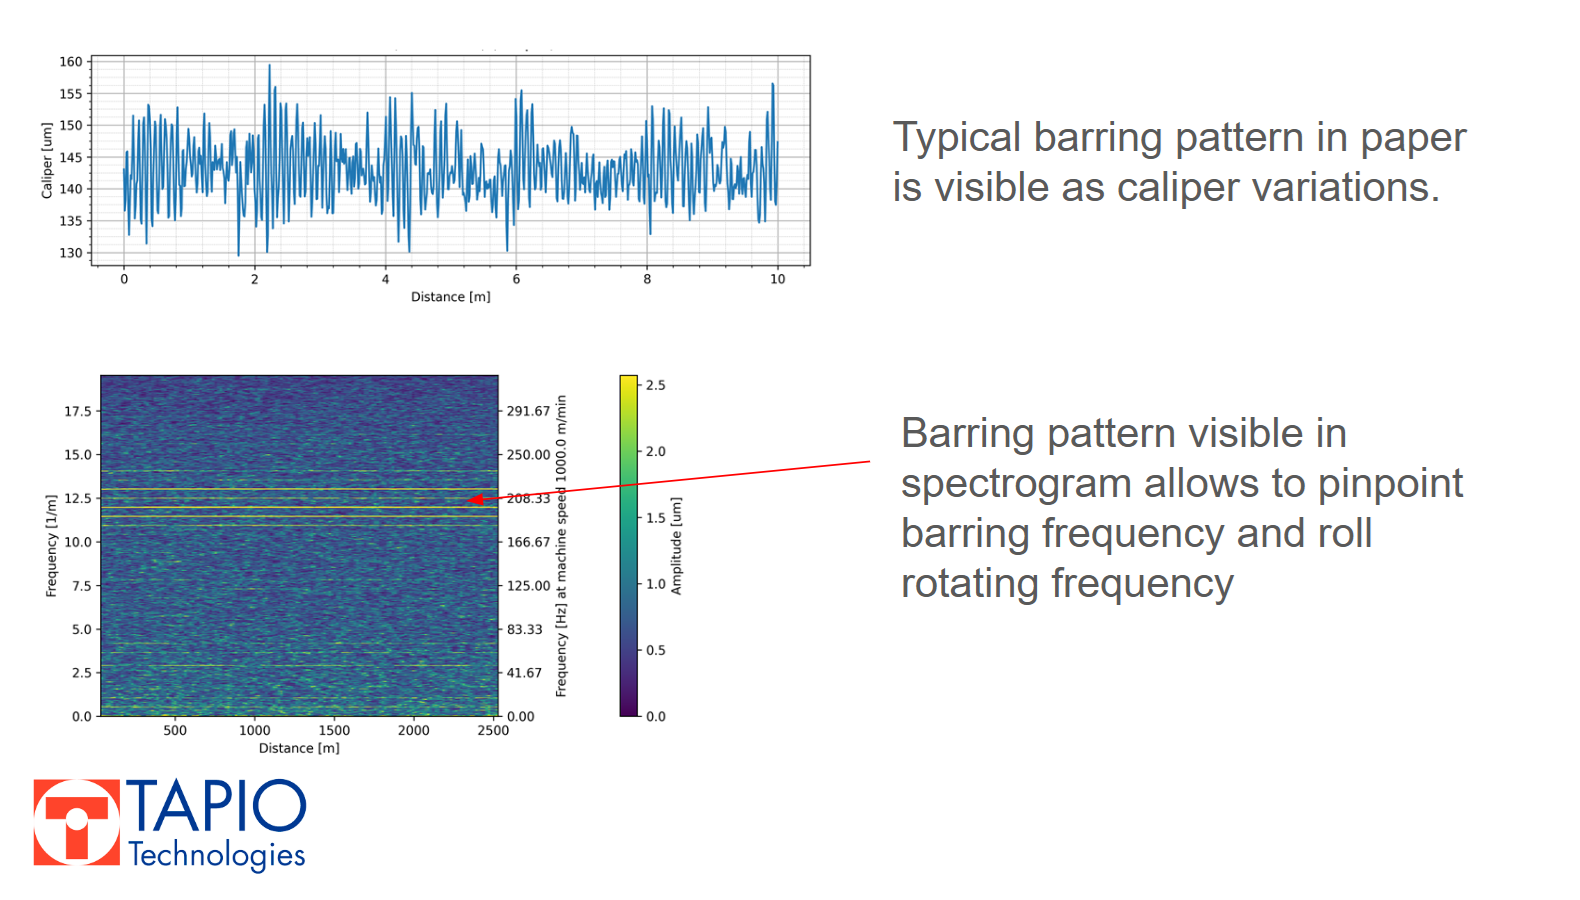
Problem: Calender roll barring causes unscheduled maintenance breaks and visible defects in the end product.
Measurement: MD rolls from the problem period are measured with several sensors at the same point. The caliper spectrum pinpoints the exact barring frequency.
Diagnosis: Overlaying the spectra of the other channels shows where the frequency already exists. A matching peak in basis weight points to the wet end, in transmission to the press section and in ash to coating. Comparing rolls from periods with and without barring narrows it down further.
Action: Maintenance and tuning are focused on the process stage where the frequency originates.
Tapio Analysis is our primary tool to measure and find sources of quality variations that other measuring systems cannot detect. The results show precise machine elements to be fixed or serviced and therefore reduce guessing during production. Tapio Analysis is our primary diagnostics support tool.
— Juha Kallio, Manager, Operations Support, R&D at UPM
Frequently asked questions
What problems can Tapio Analysis detect?
Root causes of quality and process problems across the sheet: CD and MD profile variation, barring, vibration-related defects, streaks and periodic patterns. It is also used for printability and surface quality problems such as print mottle, gloss variation and formation, and for drying-related effects such as shrinkage or instability. With a millimetre-level sampling step, it reveals variation that is not visible in online measurements or standard laboratory tests.
How is it different from online QCS scanners?
Online scanners are essential for control, but high production speeds force them to use larger apertures, lower sampling rates and heavy averaging. Tapio Analysis is done at slow speed under controlled laboratory conditions, with millimetre-level apertures, millimetre sampling intervals and minimal filtering, and every sensor measures the same point. Small-scale profile details that are not visible in online data can be seen clearly.
How is it different from traditional laboratory analysis, or instruments like PaperLab or Autoline?
Traditional laboratory tests typically give single-point or averaged values, often from separate samples or locations. The Tapio sensors are based on the same paper quality standards, but they measure continuous profiles non-destructively with a 1 mm sampling step and small measurement spots, several properties from the same physical point. That makes spectral analysis and direct correlation between properties possible.
What does it show that mean, standard deviation or CV% do not?
Two samples can have similar averages and even similar CV%, while the structure of their variation is completely different. Tapio Analysis shows whether the variation is mainly at short or long wavelengths, whether it is broadband or periodic, and whether the same variation appears in several properties. This helps separate random material variation from repeating, process-related patterns.
Which parameters are measured, and at what resolution?
The standard measurement covers basis weight, caliper, transmission, dual-sided gloss and ash, with density, bulk and relative ash calculated from them. A porosity sensor is available for suitable grades, and further physical properties can be measured at our partners after the Tapio measurement. Sample spacing is 1 mm in a standard CD measurement and 10 mm in a standard MD measurement.
How do you link a variation to a specific machine element?
Spectral and time-domain analysis find the repeating patterns, frequencies and wavelengths in the data. With the production line speed, roll diameters, rotating speeds or CD actuator spacings, the Tapio Analysis software connects periodic variation to these elements automatically. CD analysis links variation to actuator spacing, CD control or process non-uniformity; MD analysis links it to rotating components, vibration sources or drying effects. Comparing basis weight, caliper and ash from the same points shows whether the cause lies in forming, pressing or coating.
What machine data do you need, and do we need to know the suspected component?
You do not need a hypothesis: we can first characterize the variation as measured. For root cause analysis, basic production line information helps: grade, machine speed, roll diameters, rotating components and CD actuator spacings. With this data, the variation can be linked to specific machine elements or process conditions.
Can Tapio Analysis prove the root cause?
It can often narrow the possible causes substantially and, in many cases, find a strong match with a machine element or process condition. A matching wavelength, correlation or repeating pattern is evidence of a likely source, but measurement data alone does not always prove causality. Our reports separate measured findings from their interpretation and recommend further verification where necessary.
Can you compare papers, suppliers, trials or our own QCS data?
Yes. We compare total variation, wavelength distribution, periodic components and correlations between properties, which is useful for comparing suppliers, grades, production trials or operating conditions. Earlier Tapio measurements, QCS profiles and other suitable data can be included, for example in before/after comparisons or to see whether a variation has changed over time.
How much does a project cost?
Use the price calculator for an instant estimate based on standard project parameters. Final pricing depends on the exact scope and shipping. For larger projects or special requirements, email info@tapiotechnologies.com for a tailored quote. We respond within one working day, with no commitment required.
Do we need to use the Tapio Analysis software ourselves?
No. The Tapio team can handle the whole measurement and analysis process and deliver a complete report with conclusions. If you want to explore the data, the Tapio Analysis software is open source and free, and measurement data files are available on request. The software's loaders can also be extended to read QCS or other high-resolution profile data.
Related articles
Have a variation you cannot explain?
Send us your samples, or describe your situation first and we will help you scope the analysis. We typically respond within one working day.