

Downloads
Software downloads
Tapio RollView and Tapio Analysis are free, open-source companion applications for Tapio instruments. Both are standalone executables that do not require installation.
Tapio RollView
The companion software for the Tapio RQP Live roll hardness profiler. Synchronize the device, review profiles and send the data on to your quality systems.
- Download: transfer data from any connected Tapio RQP Live to the working directory
- View data: plot and display the measurements in the working folder
- Continuous mode: show the measured profiles one after another as one continuous profile instead of an average
- Alert limits: raise warnings when given statistical limits are exceeded
- Spectrum: show the intensity of periodic hardness variation at different wavelengths, which correspond to actuator spacings in the production line
- Exclude regions: leave chosen parts of the profiles out of the statistics automatically
- Postprocessors: the standard postprocessors create Excel, JSON and image files automatically; custom ones convert synchronized data into any requested format and send it to mill quality systems
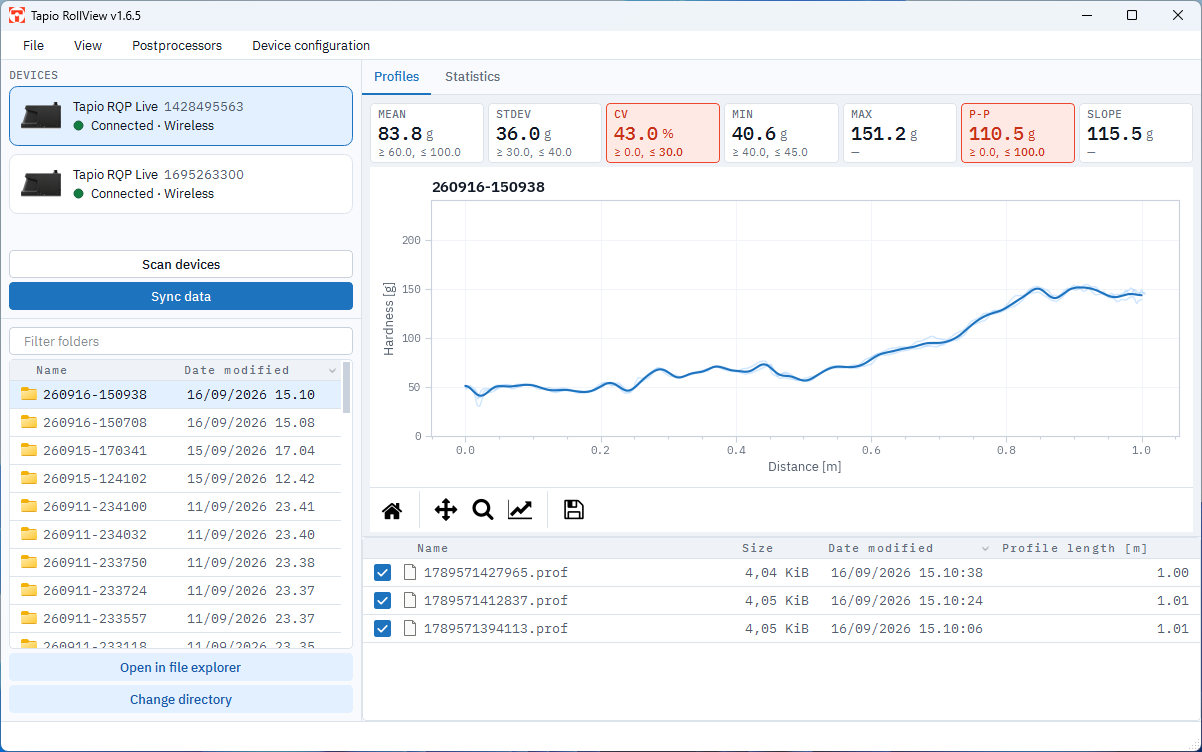
| Tapio RollView | |
|---|---|
| Used with | Tapio RQP Live roll hardness profilers |
| Installation | Standalone Windows executable; no installation required |
| License | Free and open source |
| Documentation | Manual and source code on GitHub |
| Getting started | RQP Live tutorial videos |
| Device settings | Create a QR code for alert limits and other settings with the RQP Live Configurator Tool |
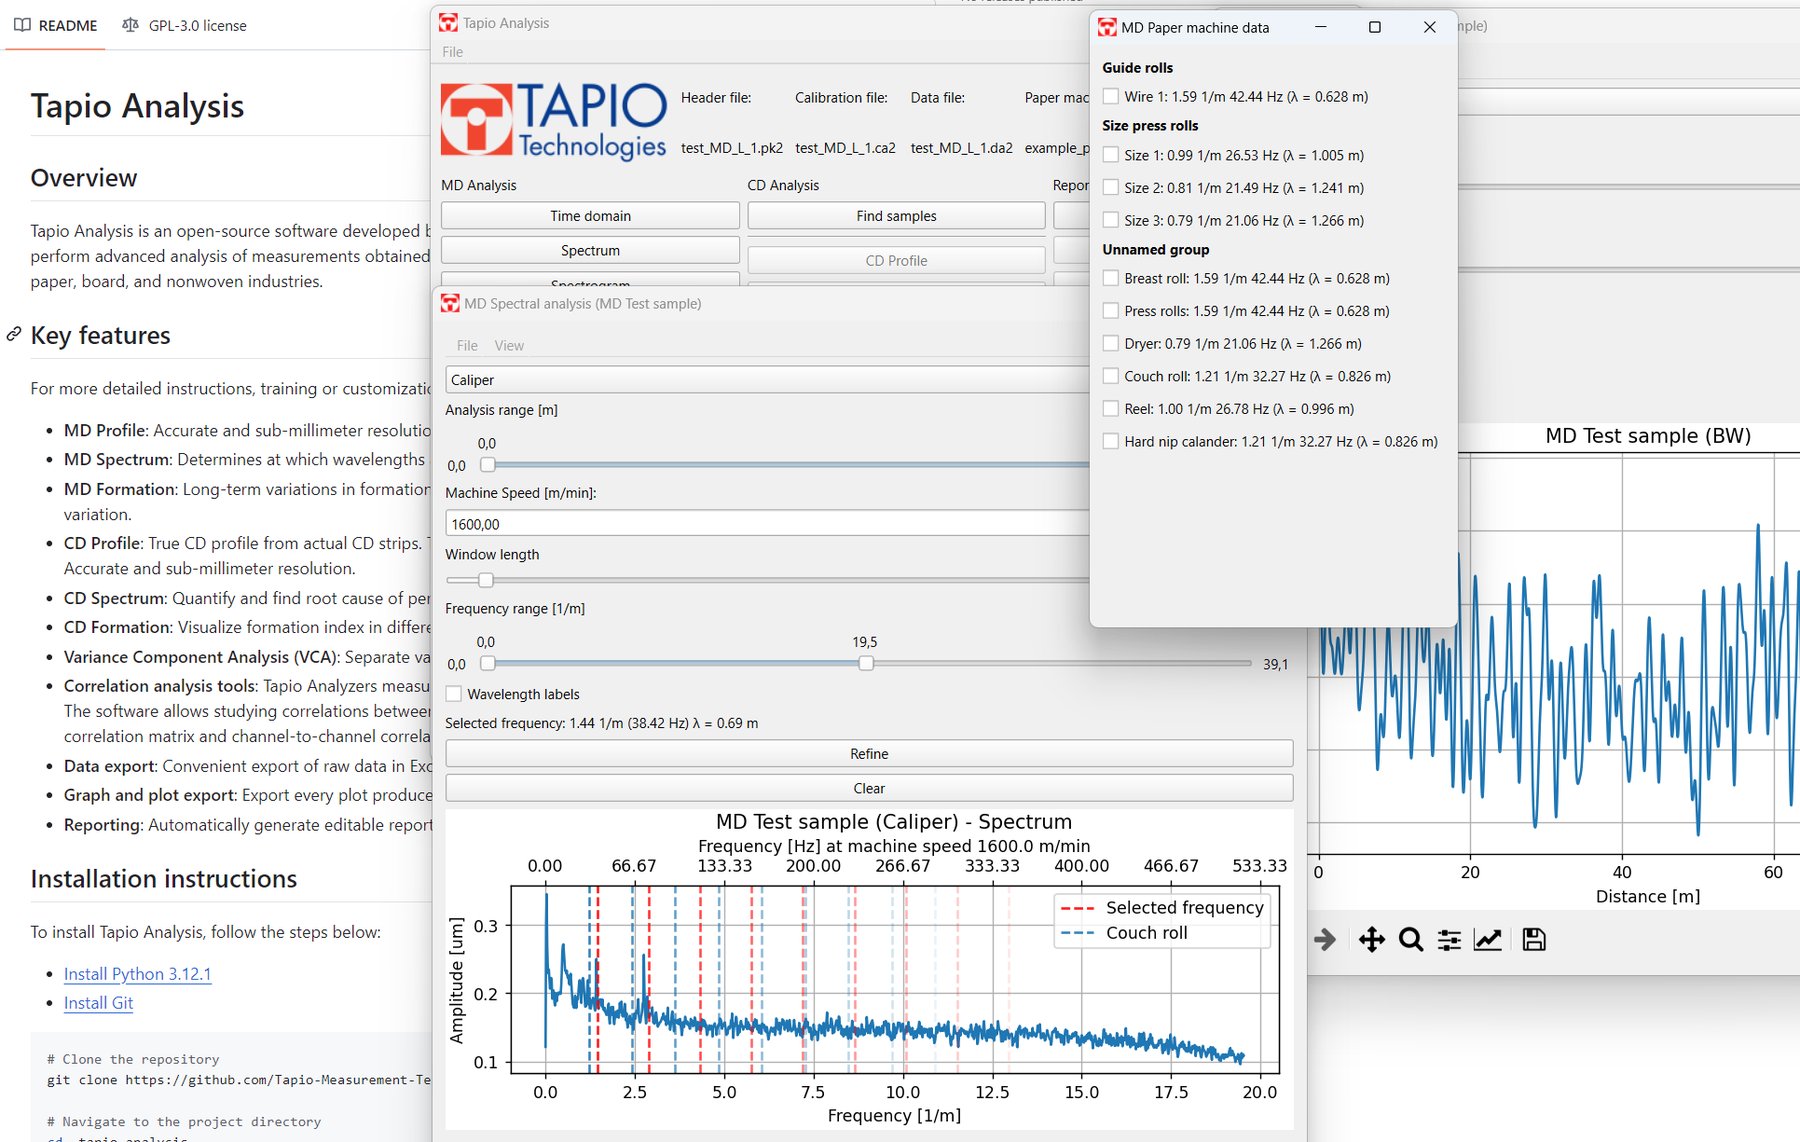
Tapio Analysis
Open-source software for analysing paper and board quality variation in measurements made with Tapio Analyzers, which are used for troubleshooting, diagnostics and quality monitoring in the paper, board and nonwovens industries. Tapio Analysis service customers can use it too: measurement data is provided on request.
| Tapio Analysis | |
|---|---|
| Used with | Tapio Analyzers and Tapio Analysis service data; other data through custom loaders |
| Installation | Standalone Windows executable; no installation required |
| License | Free and open source |
| Documentation | Source code on GitHub |
Tapio Analysis features
MD profile
Accurate MD profiles with sub-millimetre resolution, filtering and statistics.
MD spectrum
Find the wavelengths and frequencies of variation in the sample, and connect spectrum peaks to known rotating frequencies of machine elements.
MD formation
Long-term variation in the formation index, an indicator of short-term basis weight variation.
CD profile
True CD profiles from actual CD strips, with sub-millimetre resolution, filtering, mean profile calculation and statistics.
CD spectrum
Quantify periodic CD variation and find its root cause in CD controls, actuators and similar sources.
CD formation
Formation index at different CD positions.
Spectral coherence
See which frequencies are shared by, or absent from, different channels.
Spectrogram
Check how stable the periodic content is along the length of the sample.
Variance component analysis (VCA)
Separate MD and CD variation from random variation.
Correlation tools
Tapio Analyzers measure the same spot with every sensor. A correlation matrix and channel-to-channel tools show how the quality parameters relate in CD and MD profiles.
Graph and plot export
Export every plot in several image formats.
Reporting
Generate editable reports automatically from the measured data.
Need a custom loader, report or export?
Tapio can customize all Tapio software, including automatic reporting, exports to mill data systems and custom analysis features for Tapio or external data.