

PapEye software
Measure print uniformity objectively from a flatbed scan
PapEye Print Uniformity turns scanned print samples into three ISO/IEC 24790-based measures of unevenness, mottling, graininess and banding, in one pass. The results correlate well with visual quality evaluation.
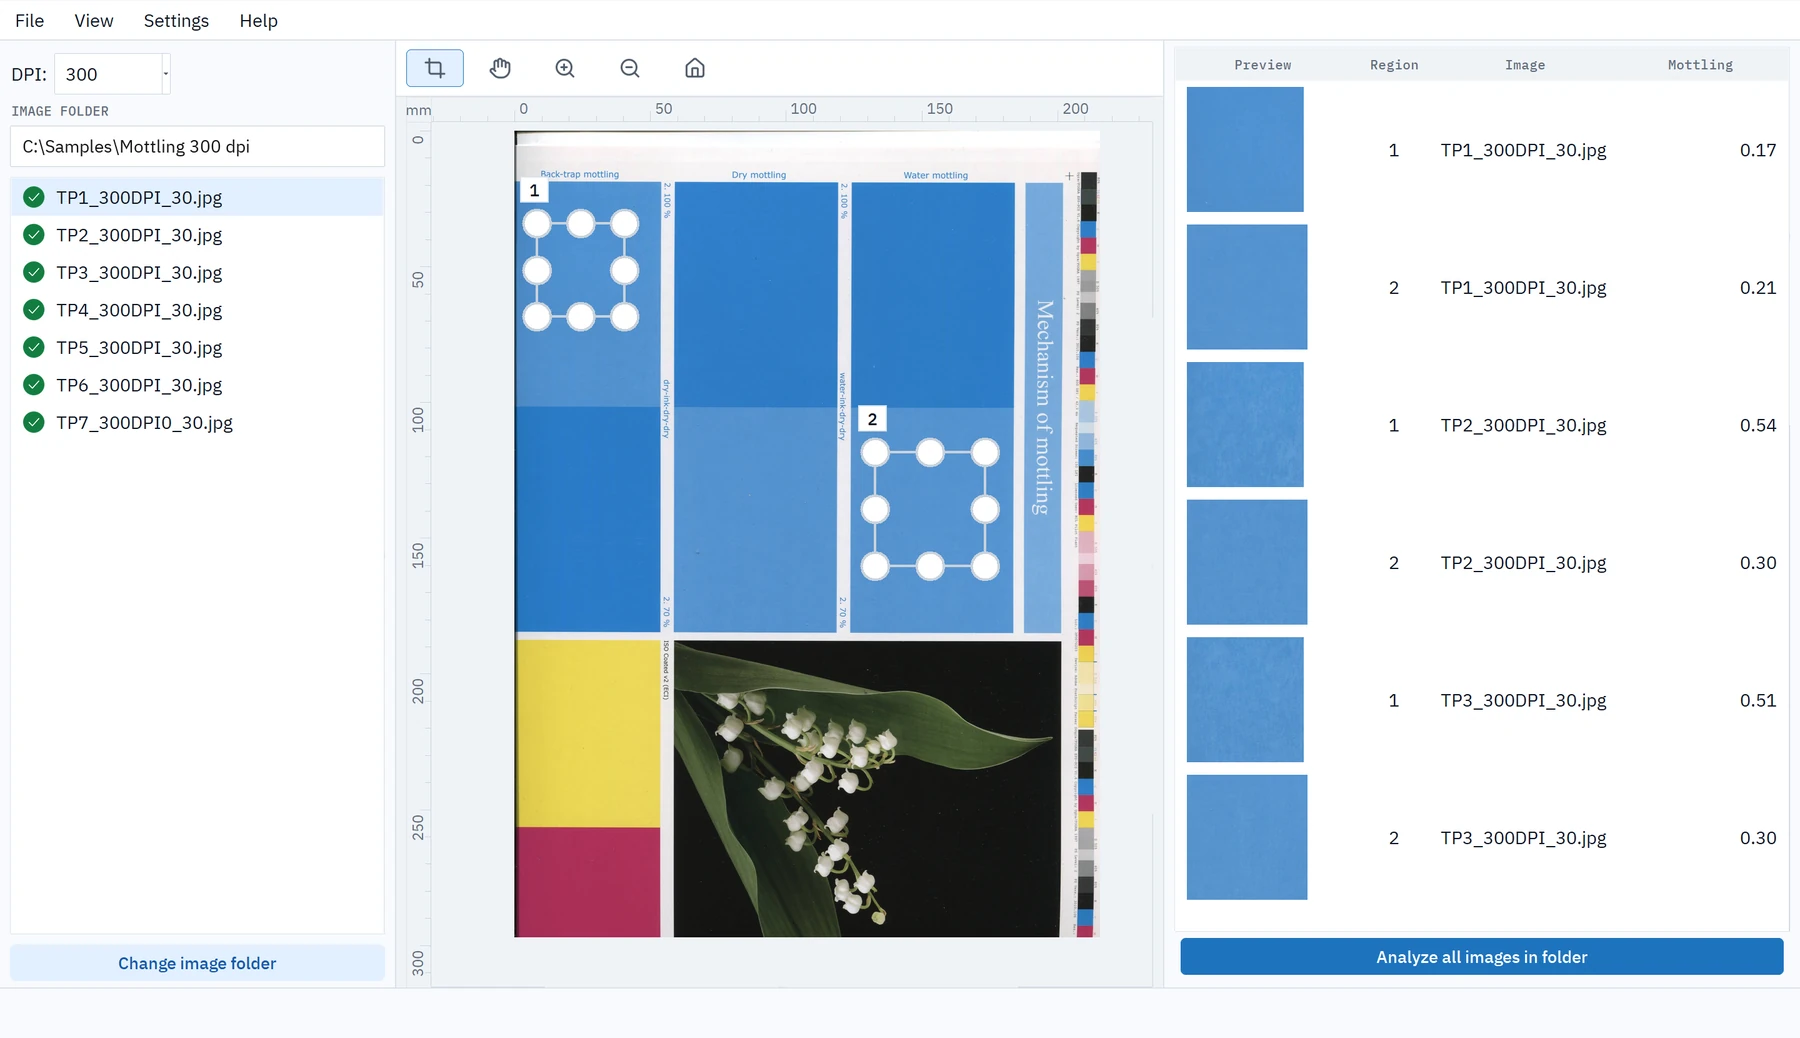
Judging print unevenness by eye is subjective. PapEye Print Uniformity gives paper, board and print professionals objective numbers instead, using computational image analysis of samples scanned with a standard flatbed scanner and algorithms from the ISO/IEC 24790 standard.
Each measure is reported as a single number describing the perceived visual evenness of the printed sample. Earlier PapEye versions measured mottling and graininess as separate products; PapEye Print Uniformity combines them, together with banding.
What it measures
Unevenness is not one defect. The human eye responds differently to variation at different scales, so print uniformity is evaluated at three scales.
| Measure | What it detects | Typical causes | Minimum region | Scanner resolution |
|---|---|---|---|---|
| Mottling | Blotching a few millimetres across, and similar marbling effects | Absorption differences, coating variation and back-trap mottle | 25.4 × 25.4 mm | 300 DPI |
| Graininess | Fine texture below approximately one millimetre | Screening, ink-film break-up and base-sheet formation | 12.7 × 12.7 mm | 1200 DPI |
| Banding | Periodic stripes running across the printed sheet | Drum, roller and feed-step periodicity in the press or printer | 150 mm across × 100 mm down | 600 DPI |
If the selected region or scan resolution does not meet a measurement's requirements, PapEye displays a dash instead of reporting an unreliable value.
How the analysis works
- 01
Scan
Scan the printed samples with a standard flatbed scanner. Use 1200 DPI to get all three measures; mottling and banding can also be analysed from suitable lower-resolution scans.
- 02
Analyze
Draw the analysis regions on the scan. For each measure, PapEye filters the region to a selected band of spatial frequencies, trims the margins, divides the area into tiles and calculates the result from the variation inside the tiles. The same regions can be applied to a whole folder of similar samples.
- 03
Report
Review mottling, graininess and banding for every region, choose which result columns to show, and export the results for the whole folder to CSV for comparison between production runs, suppliers and sample groups.
The scanner–autofeed-software combination has worked extremely well in measuring mottling. It is definitely the smartest way to carry out measurements, since there’s no need to open the scanner and change the sample after every sheet, whether you’re dealing with single sheets or 20 sheets.
— Pyry Erkkilä, Laboratory Engineer
Example results

Poor print quality: mottling 1.79
A marbled print with clearly visible blotching.

Good print quality: mottling 0.40
An even print of the same colour.
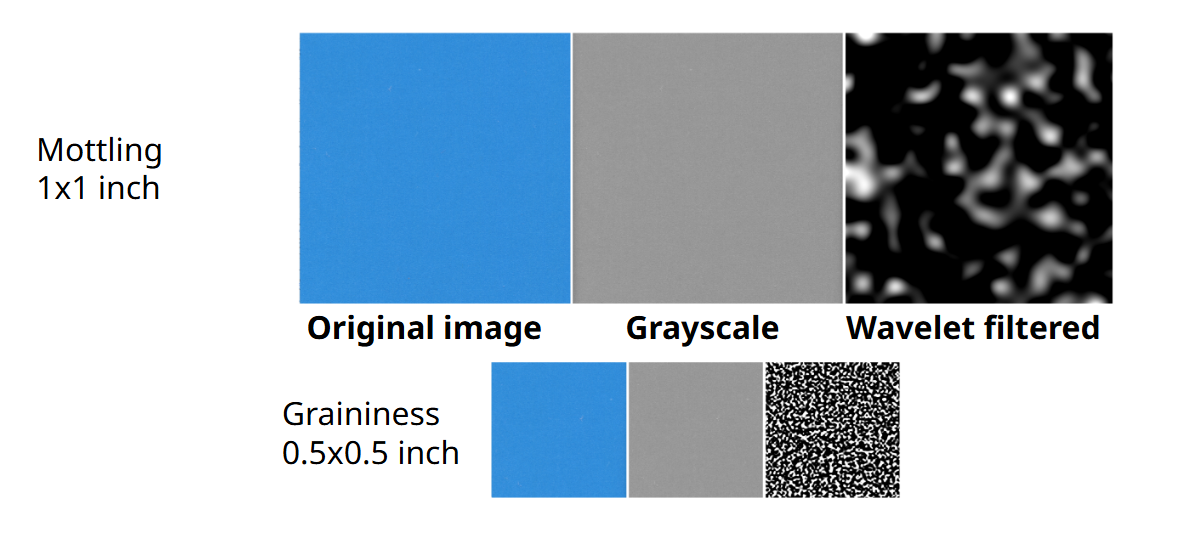
The eye is relatively insensitive to very fine variation, but very sensitive to patches within a certain size range. The measurements use spatial filtering and tile-based variation analysis to emphasise the spatial frequencies the eye is most sensitive to, so higher values mean more visible unevenness and the ranking of samples corresponds well with visual ranking.
Graininess is calculated like mottling, but at finer detail and from high-resolution 1200 DPI images.
Scanner calibration
Calibration is not required for repeatable comparisons made with the same scanner and settings; without calibration, PapEye assumes a default sRGB response. For comparable results between scanners and laboratories, calibrate the scanner's reflectance response (its opto-electronic conversion function, OECF):
- Scan a greyscale target containing patches with known reflectance values.
- PapEye fits a response curve for each colour channel and measures subsequent scans through that calibration.
- Calibrations are stored by scanner name, so a laboratory with several scanners keeps one per instrument, and a calibration can be exported to another PapEye installation.
Requirements and outputs
| Operating system | Windows, Linux |
| Application | Standalone executable with no conventional installation required |
| Scanner | Standard flatbed scanner; a list of recommended scanners is available from Tapio |
| Input formats | PNG, JPEG, GIF, BMP, TIFF and PDF |
| Result exports | CSV and Excel-compatible exports, result thumbnails and sample-region files |
| Batch processing | Analysis and export of entire folders containing similar samples |
| Command line | Available for automated and scripted analysis |
| Standard | Algorithms based on ISO/IEC 24790 |
Licensing and purchasing
PapEye Print Uniformity is sold as a permanent license for a single PC. Licenses are issued per PapEye product and per machine: a license for one PapEye product does not unlock another, and old Mottling and Graininess licenses do not automatically unlock Print Uniformity.
- Request a demo or quote from us.
- On first run, PapEye displays a Machine ID. Send it to Tapio Measurement Technologies.
- Place the license file you receive in the
.papeyefolder in the user's home directory.
Frequently asked questions
What is the difference between mottling and graininess?
The scale of the variation. Both measurements filter the scanned region to a band of spatial frequencies, trim the margins, divide the remaining area into tiles and calculate a result from the variation inside the tiles. Graininess measures fine detail below approximately one millimetre; mottling measures larger blotching several millimetres across. ISO/IEC 24790 defines separate analysis scales for the two.
Why does banding show a dash for my sample?
Banding needs a nominally uniform area of at least 150 mm across and 100 mm down, scanned at 600 DPI or higher. Patch samples are sometimes too small. Scan a larger uniform printed area to get a banding result.
Why does graininess show a dash at 600 DPI?
Graininess measures fine spatial variation reaching approximately 1.5 cycles per millimetre. From a lower-resolution scan, you would measure image resampling effects rather than the printed sheet, so PapEye requires a 1200 DPI scan for graininess.
Does the selected region have to be square?
For mottling and graininess, the region must meet the minimum size in both directions but does not have to be square; the software calculates the average within the rectangle. For banding, the directions are not interchangeable: the profile runs horizontally across the sheet and is averaged vertically, so the 150 mm minimum must be horizontal.
Can I hide measurements that I am not using?
Yes. In Settings → Show results, select which of the three measurements appear in the results table. All three are still analysed when their requirements are met, and all available results are included in exports; the setting only controls the columns on screen.
What scanner resolution should I use?
1200 DPI if you want all three measurements. The ISO/IEC 24790 measurement conditions specify 1200 DPI, and graininess requires it. Mottling and banding can be analysed from suitable lower-resolution scans; our tests have shown that mottling analysis gives equivalent results from 300 DPI scans of the same samples.
Do I need to calibrate the scanner?
Calibration is not essential for repeatable comparisons with the same scanner, but it is recommended. Without calibration, PapEye assumes an sRGB response; with calibration, measurements use the scanner's measured response curve, which improves comparability between instruments.
How do the values relate to visual assessment?
Higher values indicate more visible unevenness, and in practice the ranking of samples corresponds well with visual ranking. Compare absolute values using a consistent scanner, resolution, calibration and sample-placement procedure.
Can I analyse an entire folder at once?
Yes. Batch processing analyses every suitable image in a folder with the same sample-region definitions, and the results can be exported to CSV files.
Other PapEye applications
Measure print uniformity objectively
Evaluate mottling, graininess and banding from standard flatbed scans in one application. Ask us for a demonstration, discuss your measurement needs or request a quote.