

Article
A cross-direction profile of mottling from a batch of printed sheets
One mottling value tells you how uniform one printed area is. It does not tell you whether the sheet prints differently on one side of the web than on the other. One PapEye customer gets that answer without changing the measurement at all: they keep track of where every sheet came from, scan the whole batch in one go, and read the mottling values as a profile across the web.
Sheets whose position is known
The sampling routine does the work. Sheets are taken so that the cross-direction position of each one is known, they are kept in that order, and they go through the scanner in that order, so the folder of scans is the set in CD order and the file names carry the position.
In PapEye Print Uniformity the analysis regions are drawn once and applied to every image in the folder, so each sheet is measured in the same places on the same printed areas. The results export to one CSV file, a row per region per sheet, and plotting the mottling value against the sheet's position gives a cross-direction profile of mottling — the same way a CD profile of basis weight or caliper is read, but measured on the printed result.
What the profile shows is what a single value cannot: whether the level is even across the web, whether there is a trend from one edge to the other, and whether one position stands out from its neighbors. A difference that stays in the same place from set to set points at something fixed in the process — the coating or the calendering across the web, or a position in the press — rather than at the individual sheet.
A sheet-fed scanner, and 300 DPI
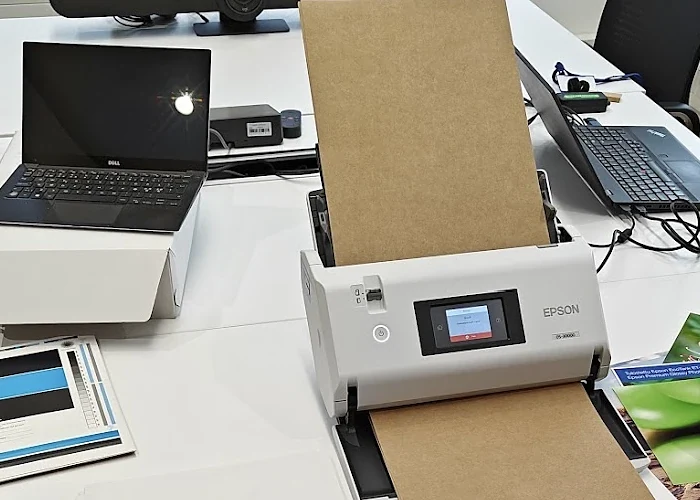
The scanner in the photograph above is an Epson WorkForce DS-30000: an A3 duplex sheet-fed scanner with an automatic feeder that holds 120 sheets, 60 of them in A3, and runs up to 70 pages a minute. A full set is scanned in minutes instead of being placed on a flatbed one sheet at a time, and every sheet passes the same optics with the same settings, which matters more for comparing sheets than resolution does. The feeder takes board as well as paper.
The scans are made at 300 DPI, and for mottling that is enough. Mottling is blotchiness several millimeters across: ISO/IEC 24790 measures it over a 25.4 × 25.4 mm region in a spatial frequency band well below one cycle per millimeter. At 300 DPI a pixel is 0.085 mm, far smaller than the smallest feature in that band. We checked it rather than assumed it: the same sheets scanned at 300 DPI and at higher resolutions gave the same mottling values and the same differences between sheets. For mottling, a 300 DPI scan is as valid a measurement as a finer one.
The other two measures are stricter, and it is worth knowing why. Graininess is fine texture that reaches about 1.5 cycles per millimeter, so it needs 1200 DPI; below that you measure the resampling of the image rather than the print. Banding looks for repeating stripes and needs at least 600 DPI and a region 150 mm across. A 300 DPI batch routine is therefore a mottling routine — which is exactly what this customer wanted a profile of.
What it takes to repeat it
- A sampling routine that records the cross-direction position of every sheet, and sheets kept in that order.
- The same scanner, the same resolution and the same scanner settings for every sheet you compare, with automatic contrast, sharpening and denoising switched off.
- Regions drawn once and applied to the whole folder, so the same printed areas are measured on every sheet.
- The CSV export in a spreadsheet, with the mottling value plotted against position.
None of this needs a Tapio analyzer or any other instrument: a flatbed or sheet-fed scanner, the sheets and PapEye are the whole measurement. If you are considering a scanner for this, ask us first — we keep a list of models that have worked well, and the feeder and the tonal response matter more than the specification sheet suggests.
Talk to us about your measurement
Sensors, analyzer configurations, software or analysis methods: tell us what you need to measure.